|
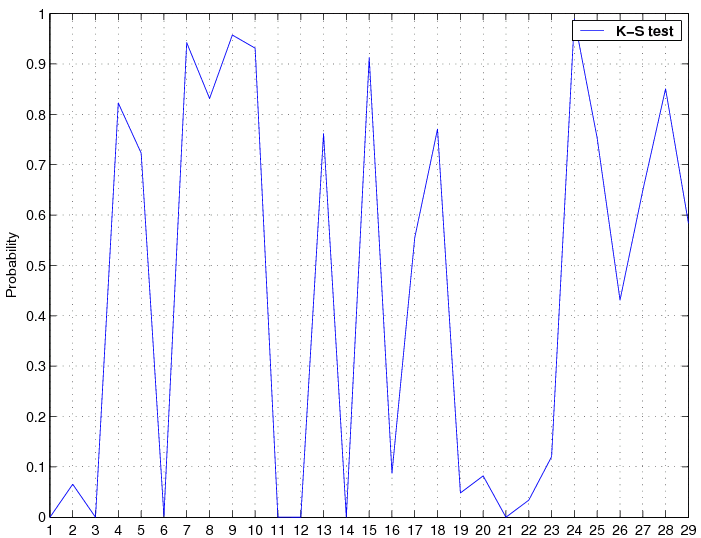
Figure 1: Quality of the EXPLORER data. The x-axis gives the number of the 11-hour block of data from the 13 day data run and the y-axis gives the corresponding probability values of the KS statistic. |
Preprint of a paper published in
Classical and Quantum Gravity,
vol. 20, No 17 (7 September 2003), S665–S676
|
|
| (1) |
|
|
| (4) |
| (5) |
|
| (7) |
|
| (9) |
| (10) |
| (11) |
| (12) |
| (13) |
| (14) |
| (15) |
| (16) |
|
| (18) |
|
| (21) |
|
| (24) |
| (25) |
| (26) |
| (27) |
| (28) |
|
| (30) |
| (31) |
| (32) |
| (33) |
| (34) |
| (35) |
| (36) |

|
Figure 1: Quality of the EXPLORER data. The x-axis gives the number of the 11-hour block of data from the 13 day data run and the y-axis gives the corresponding probability values of the KS statistic. |


As we do not have a detection of a gravitational-wave signal we can make a statement about the upper bound for the gravitational-wave amplitude. To do this we take our strongest candidate of signal-to-noise ratio do and we suppose that it resulted from a gravitational-wave signal. Then, using formula (25), we calculate the signal-to-noise dul of the gravitational-wave signal so that there is 1% probability that it crosses the threshold Fo corresponding to do, where Fo = 2 + (1/2)d2o. The dul is the desired 99% confidence upper bound. For do = 8.2, which corresponds to the signal-to-noise ratio of our strongest candidate, we find that dul = 5.9. For the EXPLORER detector this corresponds to the dimensionless amplitude of the gravitational-wave signal equal to 2×10-23. Thus we have the following conclusion:
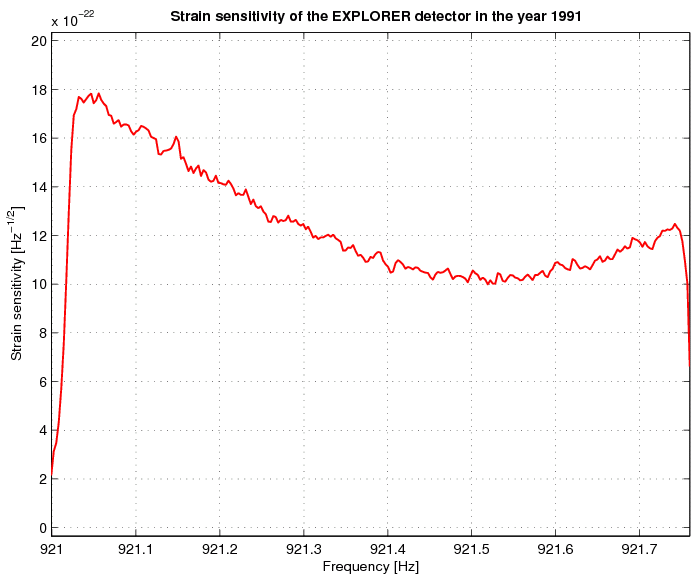
In the frequency band from 921.00 Hz to 921.76 Hz and for signals coming from any sky direction the dimensionless amplitude of the gravitational-wave signal from a continuous source is less than 2×10-23 with 99% confidence. Our analysis has been done using two days of data. We note that the upper bound will decrease as length of the data analyzed increases; dul is proportional to the inverse of the square root of the observation time To.