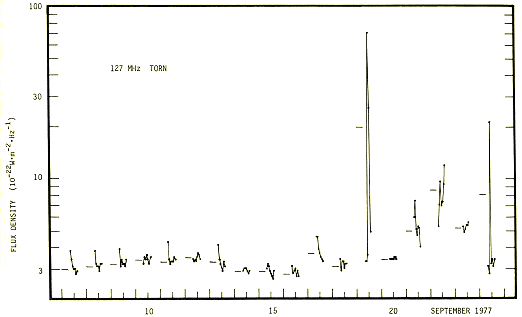
| Fig. 1. | Variations of the solar continuum radio emission at 127 MHz for Sept. 7–24,1977. Hourly and daily means for 0900 to 1400 UT are shown by points and horizontal bars, respectively. |
Report UAG–83 (1982), Part I,
130–135,
World Data Center A, NOAA,
Boulder (Colorado, USA)
| Solar Activity in September 1977 and on November 22, 1977 as Observed at 127 MHz |
by
Kazimierz M. Borkowski
The results presented here are based on the routine solar observations at 127 MHz carried out in
Torun since 1958. The main purpose of this patrol is to measure a continuum solar radio emission.
However, some distinctive events produced by the active Sun can be measured with satisfactory accuracy.
As this frequency band is one of the lowest systematically reported, it may be of interest to have its
data for periods of special study. The data are provided in the form of a table of outstanding
occurrences and drawings. To allow one to use the detailed records a short description of the
observing technique is given.
A note is made of an error discovered recently in the absolute flux scale, a systematic underestimation
of this long enduring 127-MHz data series, which may be of importance in view of prevailing
discrepancies in the meter wave solar flux determinations.
Daily observations of 127-MHz solar radio emission are made at the Astronomical Observatory of the
Institute of Astronomy, Nicolaus Copernicus University in Piwnice, with an interferometer consisting of
two antennas. The 23.74-m (10.06 wavelength) baseline of the interferometer has the equatorial coordinates
of 93.26° and 2.64° in hour angle and declination, respectively. The geographical coordinates
of the observing site are 53.0966°N and 18.5544°E. Both antennas are linearly polarized in the baseline
direction. The receiver input is switched between the antennas and dummy load, and the differential
signal is recorded in an analog form on two paper strips with the speed of 16 cm/h. A detailed
description of the receiving system can be found in Borkowski
et al. [1975].
An observing day usually covers about 7 hours around local noon, from 0700 or 0800 to 1400 or 1500 UT.
Daily records consist of 16 to 18 interference fringes with maxima spaced 23 minutes around noon
to 45 minutes around sunrise/sunset. Solar flux is measured in each of the fringes and then is
averaged to give hourly or daily means. The fringe heights are converted into flux density units
accounting for receiver nonlinearity, actual gain, and antenna power pattern. The latter is roughly
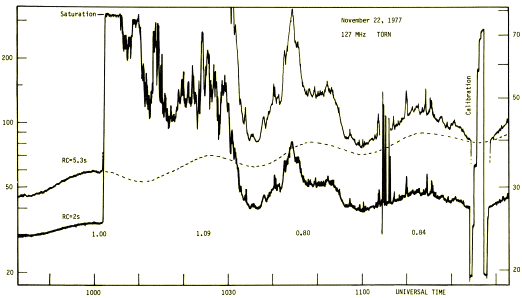
the fourth power of the cosine of the hour angle. Daily calibrations, as in Figure 3, are made to
check on stability of the gain and linearity of receiver. The flux of the Sun is referred to that of
the Cas A assuming its density of 1.40×10⁻²² W·m–2·Hz–1 at 127 MHz in the second half of 1977.
A considerable error has been found recently in the procedure of absolute flux determination
[Borkowski, 1978]. The error arose through the influence of another strong radio source Cyg A on the
observation of Cas A resulting in higher flux observations during transit of Cas A; this subsequently
led to underestimation of the flux scale. It exists in all our results reported since 1973, and probably
also in earlier observations. This problem is under investigation. However, a factor of
approximately 1.2 should be used for the flux values reported from Torun in the last few years,
including this report.
Though our measurements are believed to have a relative error of about 5-10%, normally we report
3-hourly and daily mean fluxes rounded to integers of
10–22 W·m–2·Hz–1,
i.e. with uncertainty up to
30%. Here, in Figure 1, we present more accurate mean values found for each hour in the period 0700 or
0800 to 1300 or 1400 UT. The mean flux around 1200 UT is indicated with the smaller bar on the bottom
scale, and the horizontal bars placed next to the chains of hourly means show the daily means calcu-
lated as the average fringe fluxes within 0900 and 1400 UT.
Institute of Astronomy, Nicolaus Copernicus University,
87-100 Torun, Poland
Introduction
Instrument
Observations and Data Reduction
Results
 | ||
|
Worth noticing is the slow rise and fall of continuum solar emission at 127 MHz which reached its
maximum on Sept. 10 to 12 at a level of 15 and 20% higher than on Sept. 7 and 16, respectively. These
variations as well as those for Sept. 17 to 24 are well correlated with the variations of energetic
solar particle fluxes as measured by IMP 7 and 8 [SGD, 1978].
The evaluation of distinctive events from our interferometric records is usually difficult due to
the decrease of the observed flux of the Sun in the fringe nulls as well as due to frequent man-made
interference. The resultant burst descriptions may contain inaccurate or even false values. To avoid
reporting misleading data, customarily we list only the most important and evident bursts. More complete
and reliable data can be gained by comparison with other frequency or spectral observations. This was
done for the period Sept. 7 to 24, 1977, and the results are given in Table 1. The list is the ordinary monthly report for that period [SGD, 1978]. The format of tabulation is the same as in SGD. In
the rightmost column of the table there are names (using SGD abbreviations) of stations whose observations
are correlated with the events [SGD 1977, 1978]. No effort was made to correct previously evaluated
data describing events of Sept. and Nov. 1977; therefore they are not included in Table 1.
TABLE 1. Outstanding Occurrences Sept. 7–24, 1977
|
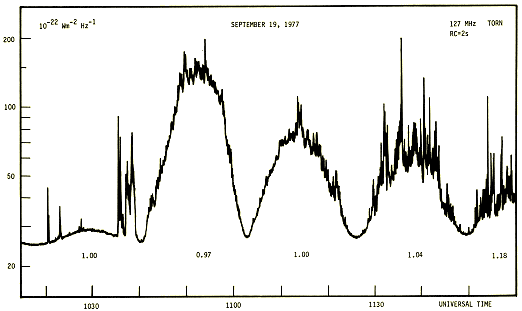
Figures 2 and 3 show prominent bursts of Sept. 19 and Nov. 22, 1977, together with the data
necessary to reduce them. To find the flux density at the maximum of a fringe one has to use the scale
on the ordinate axis and then multiply the resultant flux by the factor shown below the fringe. For
fluxes measured above the sloped part of the fringe this factor should be increased according to the
shape of the fringe, which may be approximated by a single cycle of sinusoid plus unity.
 | ||
|
The described evaluation of flux fails, however, for the record of Nov. 22 due to strong disturbances
caused by ground reflections. The received signal does not reach the sky background in the
nulls of interferometer pattern. Therefore in Figure 3 only a very rough approximation can be made.
 | ||
|
REFERENCES
| BORKOWSKI, K. M. | 1978 | Ph.D. Thesis (in preparation). |
|
BORKOWSKI, K. M., S. GORGOLEWSKI, and J. USOWICZ | 1975 | Interferometer for Observation of the Sun at 127 MHz, Postepy Astronomii 23, 141–151 (in Polish). |
| SGD | 1977 | Solar-Geophysical Data, 399 Part I, 102–112, November 1977, U.S. Department of Commerce, Boulder, Colorado, U.S.A. 80303. |
| SGD | 1978 | Solar-Geophysical Data, 403 Part II, 22–41, March 1978, U.S. Department of Commerce, Boulder, Colorado, U.S.A. 80303. |