Proc. Conf. held Univ. Barcelona, 3–7
July 1995,
,,Radio Emission from the Stars and the Sun",
ed. by A.R. Taylor and J.M. Paredes,
Astron. Soc. Pacific Conf. Series, 93, 397–399.
A Search for Periodicities
in the Solar Flux at 127 MHz |
|
Abstract:
The mean flux density of the Sun is being monitored quite systematically
at Toruń since 1958. In this study we have Fourier analysed the daily
mean values to see whether periodicities known to exist in other indices
of solar activity manifest also in these data. Besides the clearly seen
11-year cycle, we find a suggestive arguments in favour of longer period
cyclicities, especially the one at 48 years. At the other end of the
spectrum we have paid special attention to check the existence of the
recently discovered 154-day periodicity and other subharmonics of the
fundamental period of 25.8 days. We failed to detect this longest component
but fairly strong peaks do occur at certain subharmonics (at 52, 81 and 103
days). These periodicities, however, appear only intermittently. |
Single frequency solar radio patrol observations at 127 MHz have been
carried out at the Toruń station since autumn of 1958. The collected
measurements of the daily mean flux densities were recently corrected
for various factors to form a uniform data base (Gawrońska
et al. 1994).
The base (updated with the most recent results)
have the following statistical parameters:
| | Data span (Oct. 29, 1958 – Dec. 31, 1994) | 13 213 days | |
| Number of daily means | 10 348 |
| Number of missed data | 2 865 or 21.7 % |
| Mean value of flux density | 19.94 s.f.u. |
| Median value | 5.1 s.f.u. |
| Modal (most frequent) value | 3.6 s.f.u. |
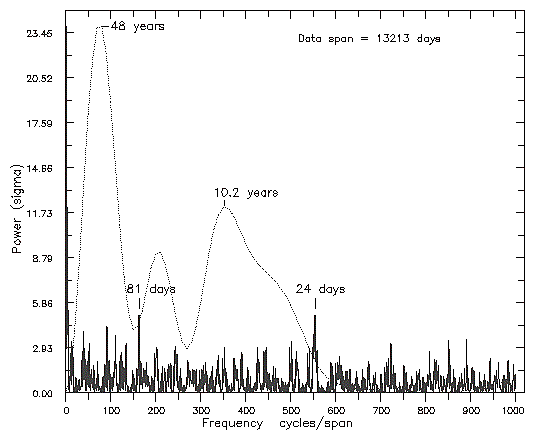
We have subjected the whole 36-year series to the classical Fourier analysis
to look for possible periodicities. At the low frequency end of the obtained
spectrum, clearly seen are peaks at periods of 48 years and 10.2 years
(Fig. 1).
The latter obviously reflects the well known 11-year solar activity. The
48-year period might be related to the 55-year cycle visible in the sunspots
(Schove 1983) or, although unlikely, it could be a spurious effect due to
finite range (span) of our data.
 |
Figure 1: Fourier power spectrum (standard deviation units) of
the daily flux densities of the Sun at 127 MHz, 1958 – 1994.
The unit on the frequency axis, 1 cycle/span, equals
1 period/(13213 days). A small portion of the spectrum at low
frequencies is expanded 100 times in frequency and plotted with
the dotted line. |
Recent years brought discoveries of number of periodicities in various
indices of solar activity ranging from 24 to 155 days. It was reported
that they last only for some years then completely vanish to possibly
reappear some time later in phase or with the phase reversed. Our spectrum
does show a few peaks in the mentioned range of periods, some of which
quite closely agree with known periodicities. We have checked their continuity
throughout our data using a sliding window for the Fourier analysis.
From our analysis it follows that (see Fig. 2):
 |
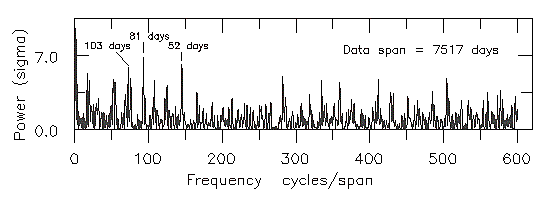
Figure 2:
Fourier power spectrum (standard deviation units) of the daily
flux densities of the Sun at 127 MHz in the period
Oct. 2, 1964 to May 2, 1985 (cycles 20 and 21). |
(1) 51.7-day period is present in the years 1958 – 1985 (in May of 1985
starts an almost 2-year gap in our data) and is especially pronounced in the
years 1980 – 1982 and to a lesser extent in 1966 – 1968. This oscillation
may correspond to the one found in the radio emission at 10 cm wavelength
by Pap et al. (1990).
(2) 103.3-day period is seen during the 20th and 21st sunspot cycle, and
especially in the years 1969 – 1976. This agrees well with Bai and
Sturrock's (1991) 103-day period that exists in the rate of large flares.
(3) 80.6-day period is detected up to 1989 and is more pronounced just
after the maxima of the sunspot cycles No 20 and 21, especially in the
years 1970 – 1974 and 1980 – 1989. 78-day and 84-day periods
were observed in the radio flux at 10 cm, in sunspot area and in
flare activity (Bai and Sturrock 1991).
These three peaks in the Fourier spectrum are at the level of about
6 – 7 σ (standard deviations).
The quite strong peak at the period of about 24 days, seen in Fig. 1,
originates in the data for 1989 to 1991 only, therefore it is almost
completely removed from the spectrum of Fig. 2.
The standard deviation (or sigma) used as the scale of the power spectral
density in our figures has been calculated for the range of spectrum shown
therein thus it is slightly overestimated.
Bai T., Sturrock P.A. 1991, Nature, 350, 141–142
Gawrońska G., Borkowski K.M., Usowicz J.B., 1994,
Acta Astronomica, 44, 141–164
Pap J., Tobiska W.K., Bouwer S.D. 1990, Solar Phys., 129,
165–189
Schove D.J. (ed.), 1983, Sunspot cycles, Hutchinson
Ross Publ. Co., Stroudsburg (Penn., USA), p. 378
File translated from
TEX
by
TTH,
version 3.12 on 19 Sep 2002.

