Amplitude Calibration at Tr
during EVN Session 2/2009
Kaz Borkowski (July 9, 2009)
Diode Temperature Calibration
(Results of some CL-type experiments
and final rxg data)
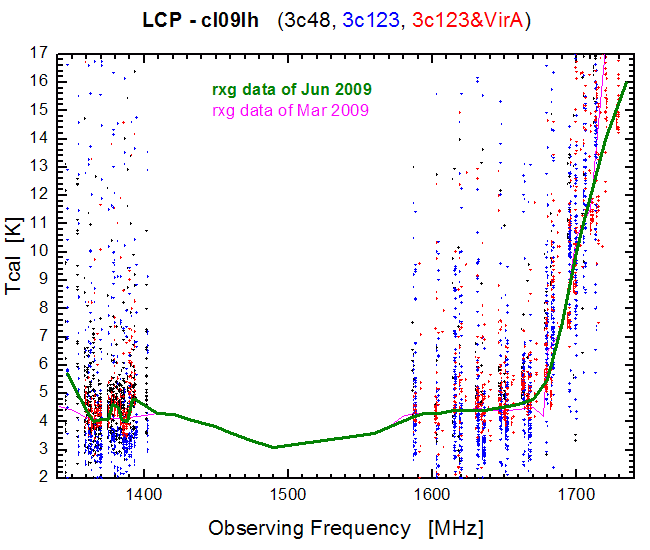
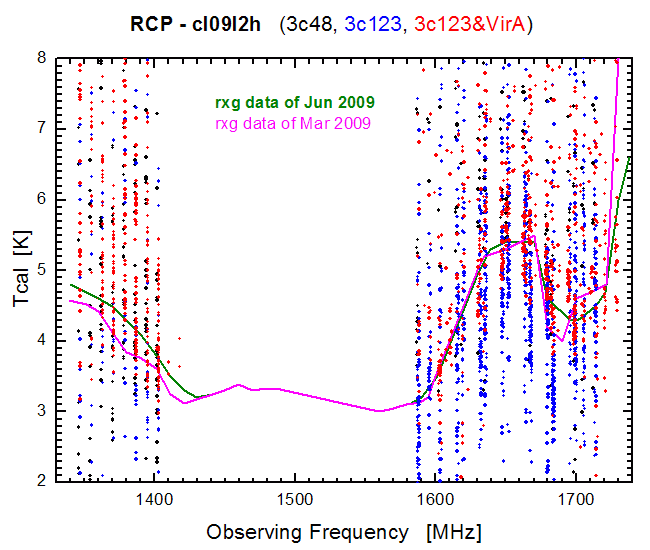
L-band measurements
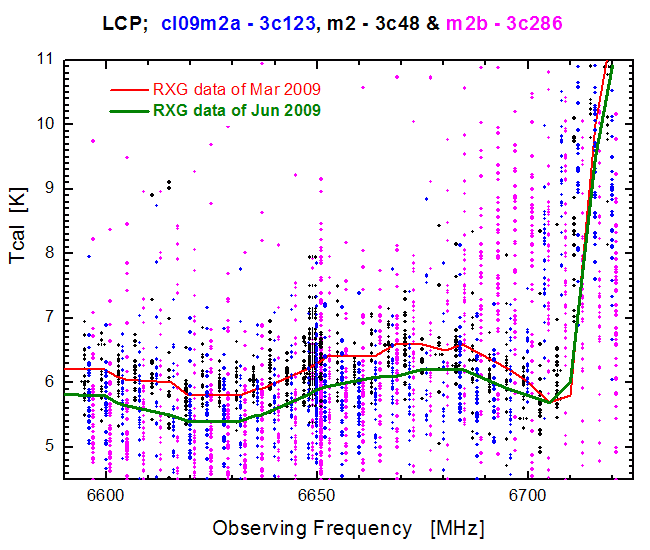
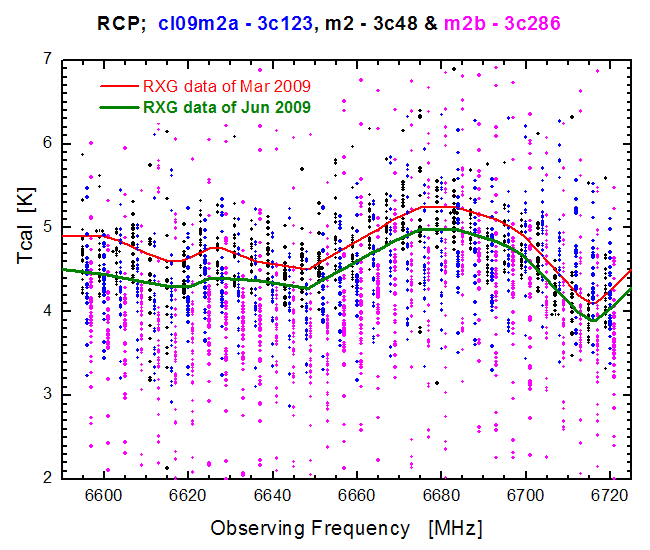
C-band measurements
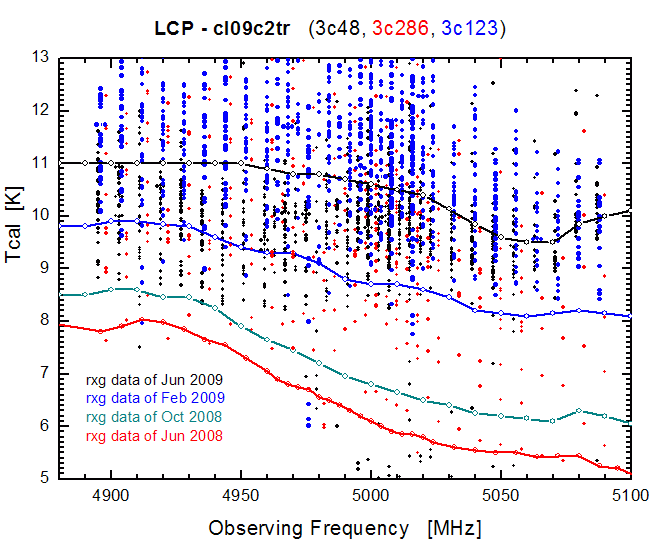
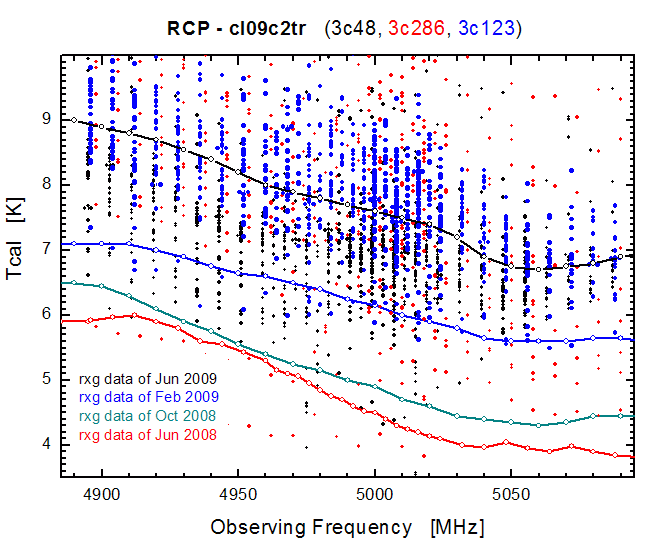
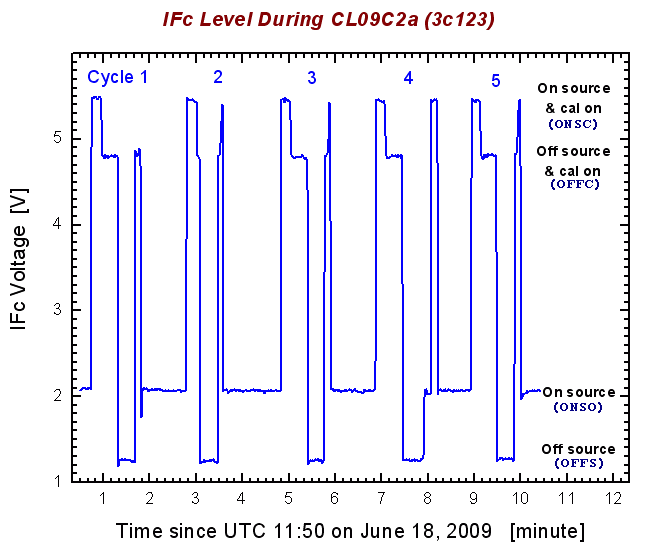
Whence this large scatter in Tr CL experiments? During one of CL experiments carried out at C-band we have captured some data from local total power (wide bandwidth) IF monitor. The diagram below shows the IFc level over about 10 minutes, while the schedule went through a few full cycles of typical onoff measurements, each comprising Field System gathering data for the quantities ONSO, ONSC, OFFC, OFFS, ZERO, ONSO and ONSC, in this order (the ZERO level is not visible on the graph since the 20dB attenution is done in the VLBA terminal, farther along the signal path). For details see relevant portions of the log file.
What is striking in this example is that out of 5 cycles of Tcal measurements only one (that marked with the blue digit 4) went as expected! In the cycle numbered 1 we see that for the last two measurements the antenna did not return on the observed source until after the last measurement (ONSC) of the cycle. Similar was the case in cycles 2, 3 and 5, where during each of the second ONSO/ONSC pair the antenna only started to move to the source. In addition, in cycle 2 the OFFC is strongly affected by improper timing. The table below shows results of calculations (for lower sideband of BBC 1 only) of the diode temperature Tcal for each of the five cycles as given in the log file, Tcal(FS) = Tcal(j)*DPFU (same is used by GNPLT application), and the variance weighted values, Tcal(VW). As could be foreseen, the two Tcal agree only in the cycle 4, elsewhere Tcal(FS) being strongly overestimated. Note that RCP was measured only in two of the 5 cycles.
Although this example presents rather extreme case, nevertheless it illustrates well how serious is this problem at our station. That is also the prime reason why we cannot use the otherwise very useful GNPLT program. Fortunately, we have a completely new, and practically ready, antenna control software which should replace the current faulty one really very soon.
|
System Temperature at Tr Station
as produced with the antabfs.pl and
plot_tsys.pl (narrower pictures) tools
(Click on an image to see it in full resolution)
Methanol-Band Experiments
n09m2 (Setup 01) |
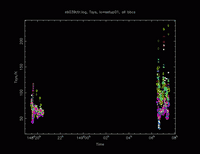
eb039c (Setup 01) |
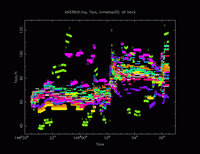
eb039c (Setup 03) |
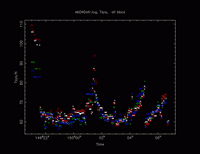
eb040a |
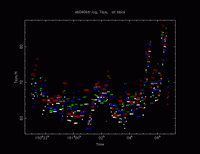
eb040b |
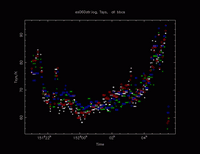
es060a |
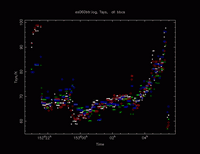
es060b |
L-Band Experiments

n09l22 |

eg040a |

em072a |

ep064e |

em072b |

ep064f |

eb041a |

eb041b |

ep063a |

ew013 |

eg040b |

eg040c |

eg042 (Setup 1) |

eg042 (Setup 2) |
C-Band Experiments

n09c2 |

ep064g |

ep063b |

ep064h |

eg040d |

eg040e |

eg040f |

eh023a |
