Some problems resulted from lack of experience with the new methods and programs, but by far not all of them. We could have lived somehow with all this burden relying on the painstakingly worked out Tcal data and on stability of the hardware (antenna gain and efficiency, and noise diode signal). Recently however the JIVE people found very large errors in the calibration of Tr data of November 2006 session. Soon it was related to modifications made in relation to non-VLBI projects carried out in the station that affected the noise diode signals fed to receivers. These modifications, which are now practically irreversible, mean a loss of the absolute calibration on all the bands! Since no longer could we rely on earlier determinations we had to get deeper into whole the process to search for reasons of our troubles so that we are able to get a new calibration for the then nearing February/March 2007 session. This required, besides studies on existing tools, to develop a set of independent tools necessary to extract and manipulate large number of quantities recorded into the observation log files during the CL experiments. This report describes some of the fruits of this endevour.
Here is a list of general sources of troubles that are known today:
— Telescope communication delays
— RFI
— BBC instabilities
— Non-robustness of existing tools to bad data
A summary of suggestions for possible implementation by EVN is presented in the end section of this report. These concern purely methodological issues and improvements to the GNPLT and ANTABFS tasks.
 | |
|
Following Dave's discovery, we found that similar delayed reaction of telescope control system occasionally appears also with respect to other commands besides that one noted, and probably it has existed since time immemnorial. Luckily enough, for other reasons our station is just in the process of exchanging of telescope control system with many upgrades, so it is hoped that this problem will automatically disapear. The new system was in fact ready before the March 2007 session, however we were forced to revert to old system because of certain new problems.
It is worth to point out that this communication problem generally is not harmful for other types of observations, since a delayed command does eventually execute (presumably in less than 20 seconds). Also, when one is aware of it, the CL experiments can be easily dealt with and reduced, though not always with the GNPLT.
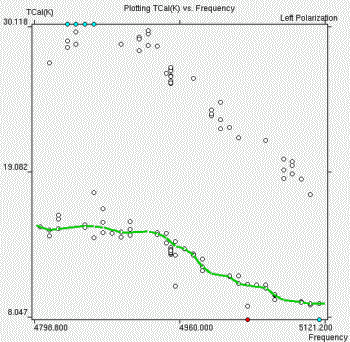
The equivalent noise temperatures corresponding to the noise signal power from calibration diode, Tcal, are being determined from the onoff data output to logs during specially scheduled CL experiments (e.g. cl07l1tr.log is the name of log file of such an experiment carried out at Tr during the first session of 2007 at the L-band). A tool specially developed for analysis of these calibration observations named GNPLT does many sophisticated tasks, one of which is generation of Tcal that are stored in so called rxg files used later by the Field System (FS) and the ANTABFS.PL. With fairly good observational data the GNPLT gives nice results. Torun observations however always were and continue to be affected by instrumental problems as well as by RFI. Here is an example of Tcal computed by GNPLT from one of experiments done in the presence of rather strong RFI with the FS onoff run with 1 repetition.
 |
|
Obviously enough, such data alone cannot be used for even moderately reliable determination of the Tcal due to the large scatter of measurement points, which most probably is the effect of RFI.
 |
Fig. 3: The same data as in the preceding figure but computed using simple averaging of measurements (shown by the open circles), that are meant just to reproduce those of the GNPLT, and slightly more elaborate averaging weighted (red dots; see the main text for details). The weighting made most of the scattered data above about 5 K to migrate to the lower part of this figure (where they partly overlap); they did not fall outside the display scale or frame. Click on this image (or here) to see the same thing done for the other polarization. |
The second image above, Fig. 3, has been prepared independently of GNPLT using the following formulation to calculate the Tcal (FORTRAN code):
	Cal=(  (BBC(3,i) - BBC(4,i))/(BBC(3+22,i) + BBC(4+22,i))
     & + (BBC(2,i) - BBC(1,i))/(BBC(2+22,i) + BBC(1+22,i))
     & + (BBC(7,i) - BBC(6,i))/(BBC(7+22,i) + BBC(6+22,i))  )
     & / ( 1/(BBC(3+22,i) + BBC(4+22,i)) + 1/(BBC(2+22,i) + BBC(1+22,i))
     & + 1/(BBC(7+22,i)+BBC(6+22,i))  )

	Sour=(  (BBC(1,i) - BBC(4,i))/(BBC(1+22,i) + BBC(4+22,i))
     & + (BBC(2,i) - BBC(3,i))/(BBC(2+22,i) + BBC(3+22,i))
     & + (BBC(6,i) - BBC(4,i))/(BBC(6+22,i) + BBC(4+22,i))  )
     & / ( 1/(BBC(1+22,i) + BBC(4+22,i)) + 1/(BBC(2+22,i) + BBC(3+22,i))
     & + 1/(BBC(6+22,i) + BBC(4+22,i))  )

	 Tcal=Cal/Sour*Flux*DPFU
In this code the BBC variable contains data read from the #onoff#
records present in a log file, the second argument of the BBC variable (i)
represents the channel number (1 to 18, corresponding to 8 BBCs each with two
sidebands plus two wide bandwidth IF channels) and the first is the type (level)
number of a measurement or the number of corresponding standard deviation
(here equal to the type number increased by 22). The numbering of the types
is according to the following assignment:1 - on source BBC level
2 - on source plus noise diode on
3 - off source, diode on
4 - off source, diode off
5 - zero level
6 - on source, diode off
7 - on source, diode on.
In the logs these levels are placed in this order for 1 repetition of the onoff measurements. Flux is the source flux density and DPFU is the conventional conversion factor in units of Kelvin per Jansky.
Using the same notation the TCal(K) data that the GNPLT is displaying and working on are reproduced with this very simple FORTRAN code:
      Cal  = BBC(3,i) - BBC(4,i)
      Sour = ( BBC(1,i) + BBC(6,i) )/2 - BBC(4,i)
Our somewhat more complex expressions are in fact also simple averages
of the same three measurements of source or cal signal height
(written as the differences
of on-source BBC level minus off-source level or analoguous difference
of cal-on minus cal-off level) weighted by reciprocals of the corresponding
variances of the three differences involved in each average. Each variance
as assumed for the weight of corresponding height is taken as the sum of variances
of the differenced levels. Thus, in mathematical notation, both the Sour and Cal
quantities really have this simple form:
( Σ Δx/σ2 ) /
( Σ 1/σ2 ).
The variances of individual level measurements are just squared
standard deviations that in logs accompany the BBC levels, just next to them.
Naturally, using the variances for weights is our arbitrary
choice, but final results are rather insensitive to this choice
(we have tried to use here the square root of variance and obtained
almost the same results). The higher power the weights are rised to,
the stronger rejection of less accurate measurements may be expected.
Thus it would be sensible to consider even squared variances for weights,
but we did not go that far.
RFI invariably reflect in much larger standard deviations. While we have seen good data having the deviations below 10 BBC counts, the spoiled ones were usually above 50, and not rarely reaching a few hundreds. When using the averages weighted by deviations squared the bad data get automatically downweighted very effectively. Even if two of the three averaged quantities are very badly RFI affected, the output may still be acceptable for it will relay on the third measurement alone. This is prominently illustrated in the second of the discussed figures (Fig. 3). Of course, no improvement can be expected if all data are contaminated by RFI or hardware instabilities
Stations are obliged to prepare after each session the ANTAB formatted files, containing the system temperatures (Tsys) for each frequency channel of each experiment. This is done with the ANATBFS suite of scripts which read and analyse the FS experiment logs using data of the band rxg file. A user is given a limited possibility to interactively edit read data (by removing supposedly spoiled measurements).
There are two disturbing problems at the Tr station related to this stage
of calibration:
(1) Frequent large jumps of the Tsys value as a function of time, and
(2) Large scatter of the Tsys as a function of BBC channel.
For example, in all the C-band Tr experiments in the March 2007 session Tsys
values spanned 6 to 8 K above a minimum at given time (which ranged from 18
to 31 K, depending
on experiment and time within it) while at the L-band the span was 10 to
as much as 50 K (with the minimum of 15 to about 40 K). The following figure
(Fig. 4) is a snapshot of the ANTABFS.PL produced screen captured during
the analysis of f07l1tr.log.In this experiment both the problems are
eminently present.
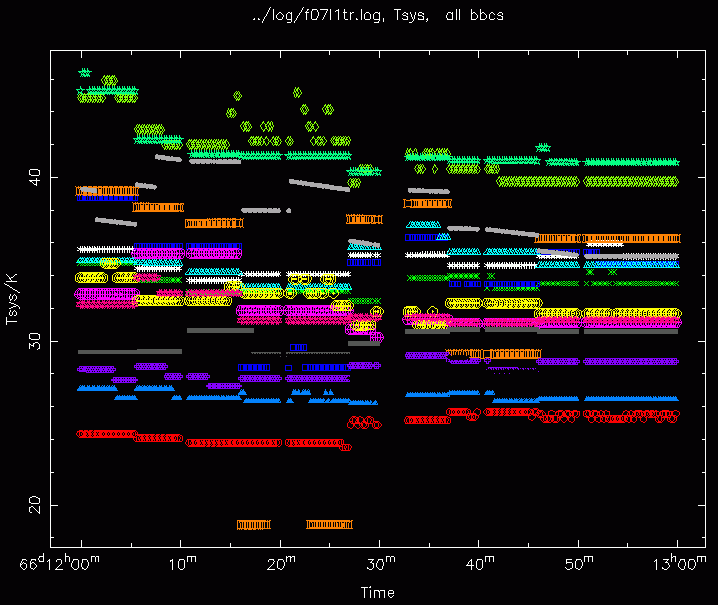 Fig. 4: Final ANTABFS.PL screen captured after the edition and analysis of the f07l1 Tr experiment. Data from different channels are displayed in different colour. |
Here at the very beginning, just after 12:00 UTC we see that the Tsys,
calculated for different BBC channels, ranges from 24 to 45 K and slightly
less, 25 to 41 K, at the end.
There are also sudden jumps, although they are less apparent in this figure because of too rich contents. The next figure (Fig. 5) comes from an earlier processing stage of the same experiment and shows the (yet unedited) Tsys in one of the 16 channels, in which very large jumps of the Tsys occur.
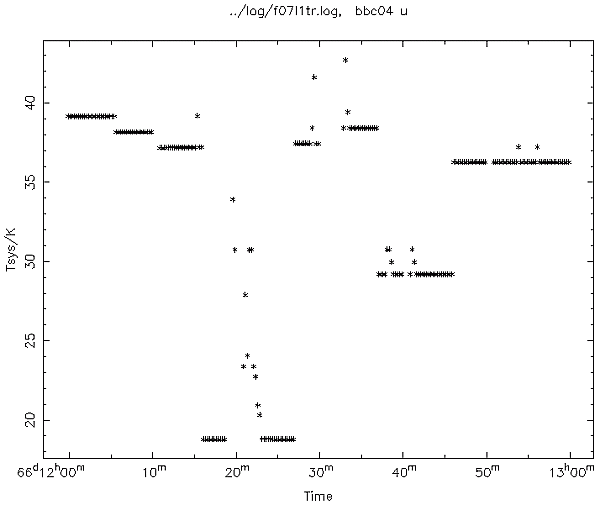
|
In order to see wherefrom such jumps come, we performed an analysis
of the original calibration data present in this experiment log. They are
plotted in the next figure (Fig. 6) after applying only a scaling factor.
The Tsys taken directly from the f07l1tr.antabfs file has been added
(pink coloured) to facilitate comparisons.
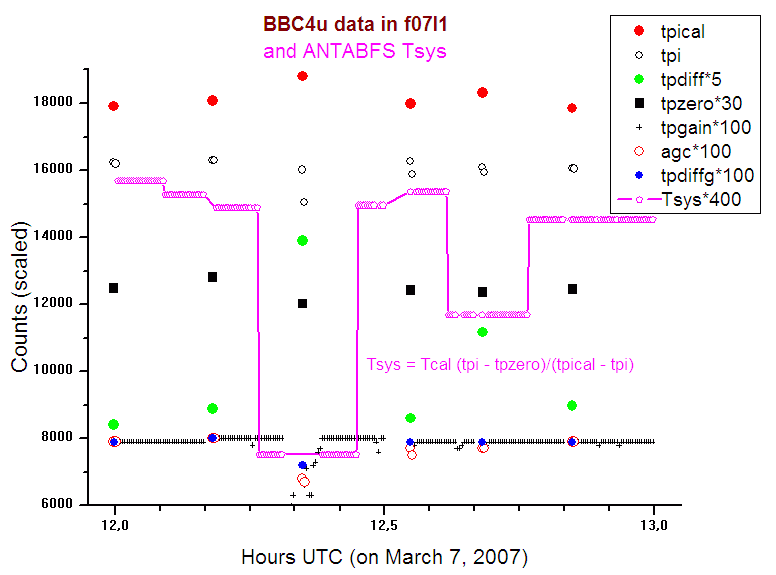
| Fig. 6: All the original calibration measurements in BBC4 USB of f07l1 (some are scaled to fit in this figure frame). The pink symbols represent the data taken from the final '.antabfs' file thus they are clean of measurements affected by bad tpgain data (the tpgain data are shown here with the black crosses in the lower part of this figure, and those bad clearly depart from the rather stable level elsewhere). The shorter ticks of the UTC scale are drawn every 5 minutes. |
As seen from Fig. 6, measurements made for the direct Tsys calculation were performed every about 10 minutes. At around 12:20 some disturbance affected the tpical and tpi measurements. As the result a large error has been transferred onto all the ~10 min long section of Tsys derived from the more frequent tpgain measurements. Apparently a similar mechanism was in force in the two 10-minute periods that followed.
We now pass to the second problem. The earlier noted excessive dispersion of
Tsys across the channels (as in Fig. 4) could easily
result from nonlinearities inherent in a hardware, essentially in our BBCs.
Although our earlier measurements
seemed to reject this possiblity, here we present further study based on
entirely different approach than in those earlier attempts.
We performed a CL-type observations at the C-band (since it is less affected
by RFI) but have set up identical working conditions
(frequency, bandwidth and polarization) for all the 8 BBCs and run a schedule
for the upper and lower sideband in turn, and subsequently repeated the entire
procedure for the other IF polarization channel. The onoff program has been set
according to this command:
onoff=1,5,75,1,600,ia,ic,1u,2u,3u,4u,5u,6u,7u,8uand its call was preceded by the bread command (to monitor BBC states).
Now we know from recent email discussion with EVN experts, that in fact we could have measured all the 16 channels at once (though it appears this may not be practical for stations with full set of 14 converters).
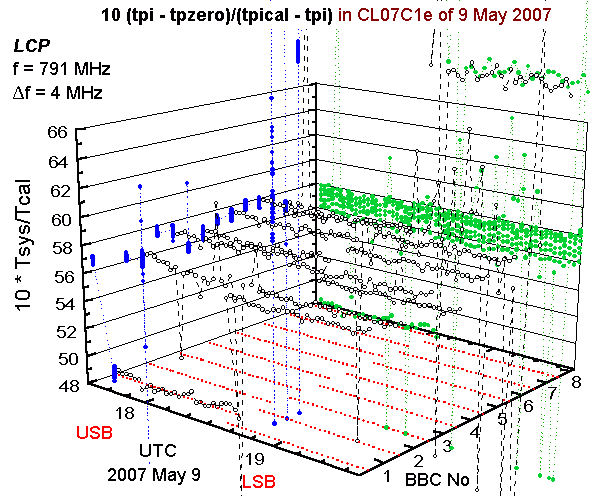
The onoff records in the resulting log file were then used to calculate the ratio of background power above 'zero' to cal signal height (measured above the background). Assuming the channels give the linear response to an input signal power, the ratio should be completely independent of the channel at given polarization. Fig. 7 presents this ratio multiplied by 10 to pretend the system temperature.
| Fig. 7: BBC behaviour during C-band observations of 3c249 performed on 9 May 2007. All BBCs were tuned to same IF frequency (thus also same sky frequency of 4992.99 or 4988.99 MHz) and polarization channel, LCP. In the middle of observations (at about 18:35 UTC) the BBC upper sideband was changed to lower sideband. BBC 8 was 'unlocked' all the time, so that its data are not very useful; also BBC 1 USB and BBC 7 LSB channels were evidently unstable and gave ubnormal results. The measurements did not stop as shown but continued for about the same long periond of similar observations with the RCP signal fed to all BBCs (click on the image to see those data). |
In this figure we see there are three BBCs with evidently wrong behaviour.
Two of these (those with channels BBC 1 USB and BBC 7 LSB) all the time were
locked but occasionally were losing the 1pps, while the third, BBC 8,
had good 1ppc but was unlocked all the time.
Neglecting these four bad channels however, one finds that the good
channels in LCP give a 10*Tsys/Tcal spread over about 2 K
at the mean level of about 57 K (care for the green points projected onto
the right side vertical plane in Fig. 7 or projections in blue on the left
vertical plane). In the other polarization this quantity has considerably
smaller spread (there the signal was much stronger, so that the agc levels
in all BBCs, save BBC 8, after switching to the IFc channel have dropped by
about 5 dB).
We believe thus that these measurements demonstrate (and confirm earlier conclusions in this respect) not so bad linearity, since the spread of about 4 %, or 2 % error should be acceptable to the EVN standards. In any case, such an error does not explain the observed channel to channel dispersion of Tsys in session experiments. On the other hand, 2 % may not meet manufacturer's specifications of the BBC devices, so it is possible that there are other sources of nonlinearity besides the BBCs themselves.
Keeping in mind the quite nice convergence of BBC levels to zero in our earlier linearity checks we have analysed also another Tsys-like quantity, namely tpi/(tpical - tpi), using the same observations of May 9, 2007. Unfortunately, the dispersion of such Tsys turned out considerably greater than that seen in Fig. 7.
We are left with no choice but to conclude that the nonlinearities of our BBC devices do contribute a few percent to the Tsys channel to channel variability, but likely main causes of the large Tsys dispersion remain BBC long term instabilities plus RFI, which are persistent and strongly frequency-dependent in the L-band.
Methods/algorithms
1) Tcal and Tsys measurements should take into account measurement
errors. As indicated in this report, this may constitute an important
future tool in dealing with the ever worsening problem of RFI.
For Tcal we already have the necessary data from onoff measurements
in the logs of CL-type experiments. To be able to include the weighting (or other type
of dicrimination) of measuremets for Tsys in typical experiments it would require
modification within FS, so that such data as tpi, tpical and tpzero are all accompanied
by the standard deviations.
2) Onoff measurements scheme could be somewhat modified to (A)
make acquisition of data, that are to be later differenced, to take place immediately
one after the other. This would minimize effect of the slow variations in receiver gains.
While doing this we might (B) assign the lowest priority to the gain compression
measurements, which practically do not contribute to accuracy of final results. A minimal
version of basic sequence could be e.g.:
tpcal(onsource), { tpi(onsource), tpi(offsource), tpical(offsource), tpzero },
with the part enclosed in
braces optionally repeated a few times. However, it would be much better
to have certain degree of redundancy already in one repetition, which would
allow for effective rejection of badly contaminated measurements. One
possibility would be to split each integration time into two halfs, so that
we would have always two adjacent measurements of every quantity. Another
possibility is just to supplement the basic sequence (that in braces above)
with tpi(onsource), tpi(offsource) and tpical(offsource). The latter, while
more time consuming, has
the advantage of placing the repeated measurements well separated in time,
so that intermittent RFI are easier suppressed by the weighting in
subsequent processing.
3) While calculating the Tsys or other quantities, the difference to tpzero
should be increased by 1 % of neighboring tpi to account for
the 'zero' level being about
100 times (20 dB) smaller than that of tpi. Otherwise we allways have this
small bias in Tsys: (tpi - tpi/100) = tpi*0.99 so also Tsys*0.99 instead
of Tsys.
4) Tsys as being found by ANTABFS and based on tpgain as proxy may not
be the best choice. We would suggest to 'continually' measure just tpical and
tpi instead of tpgain and to measure tpzero only once in a while. The ratio
tpi/tpical should be quite gain independent. Also,
tpzero could be tested for abnormal values (in magnitude or standard deviation)
and in case of problems (which in fact may not be too frequent, but they
do happen) automatically replaced by the last good value or by tpi/100. This
scheme should also eliminate the familiar steps in continuous Tsys that
are due to the quantized nature of the agc gain (tpgain).
5) Field System or its respective programs while measuring the signal power
might also do some crude internal weighting before storing the results in logs.
A simple algorithm could be based on the above mentioned splitting of integration
period into two halves, but certainly more general case of having a number, say N,
of equal length (e.g 0.5 second) sections would be still better.
Let i-th section of averaged data yield the mean value xi and
the variance (in practice to be calculated as the rms squared)
vi, then the values output to logs could be calculated as
(1) x =
(Σ xi/vi) /
Σ 1/vi,
where the summations are carried over all the N sections.
The x quantity represents an unbiased estimate of the mean value in the entire
integration period. However, so obtained value has in general the error (standard
deviation, or rms value)
different than for the normal (arithmetic) full period averaging, which would be just
σ = (Σ vi)1/2 / N.
We propose that for the suggested
kind of weighting the error of x be estimated from
(2) σ'
= 1 / (Σ 1/vi)1/2.
When all vi happen to assume the same value, these formulae get equivalent
to the case of not weighted averaging. Setting N = 1 reduces them similarly.
Being relatively simple, the extra computations according to Eqs. (1) and (2) could
possibly be implemented without excessive FS changes. They, of course, would
not require any other procedure to be modified.
GNPLT wishlist
1) Useful might be a new option to append (not replace) data from an
additional cl*.log file to have final results based on more than one
experiment. A possibility to read in a specified rxg file would also add
to functionality.
2) Names of currently analysed rxg and log files could be displayed
somewhere on the GUI.
3) An extra option to display error bars would also be useful in discerning
bad points.
4) We propose an extra option to toggle inclusion/removal of IFa and
IFb (wide bandwith) points (presently they are included automatically,
if present in the log file, which may lead to false Tcal if the user does
not explicitely delete them).
A CL experiment may be made not to record these data, but they are useful
in case of problems. (Dave Graham also has pointed to this IF channels
problem in a recent mail discussion.)
5) Yet another option to work on or display data from only a user chosen
channel(s) seems desirable.
Possible bugs
6) While writing to the rxg file new Tcal, the GNPLT should aenable
to comment out ALL old data, because the remaining old ones may not
be valid any more (we noted
some old values remaining when the new Tcal enveloped range of
frequencies narrower then the range of data present in the rxg file).
7) Plotting of the 'Tcal(K) Curve in the file' (the green curve) sometimes
shows some weird features (see Fig. 2 above). We did not discover
the reason. However, it might be related to differences between various
versions of the operating systems and compilers since in at least one
other run of GNPLT with the same data as in Fig. 2 (same cl and rxg files)
performed on an other installation of the FS (although same version)
the extra green
features were not present. Thus it would be helpful if the same data
were looked at in an other station environment (the cl07l1c.log and
mar07trl.rxg files are available from vlbeer, the mar07 directory).
8) GNPLT seems to report wrong number of data as mentioned in caption
to Fig. 2. (have a glance at the other picture linked to Fig. 2,
wherein full GUI indicates also the total number too small by 1).
ANTABFS
For each frequency channel the ANTABFS
lets the user to choose from keyboard an option to edit or go ahead to
the next channel. When upon inspection of the displayed measurements
he decides to edit, the display is replotted and only then the editing is
enabled. If observations are made in the presence of RFI (which happens
almost always at L-band), virtually every channel (BBC and sideband) data
have to be edited during the ANTABFS session. Life of the user would thus
be more pleasant if he got the editing enabled already in the first
popup of displayed data and had there one or two more options
(besides the 'end editing and replot', something like a 'proceed to
the next channel') for picking with the mouse, besides these keyboard
options. The idea is to free the user of excessive switching between
windows (the x-window where ANTABFS.pl runs, and the graphical display
of output data).
Posted: May 29, 2007; last modif.: Dec 6th
