|
Similar studies of other possible solutions connected directly or
indirectly with the projected RTK telescope were presented in earlier
reports: 1. 80-metre offset paraboloid (June 2006) 2. 90-metre offset paraboloid (May 2009) 3. RT32 with OCRAp/f (pointing and gain) (June 2005) 4. Follow-up of the above (OCRA-f) (July 2006) 5. Properties of the RT32 enlarged to 36 m (in Polish; January 2009) 6. A 90 m Transit Radio Telescope: Offset or Symmetrical? (September 2009) |
             Cassegrain radio telescope geometry

 Aperture diameter, D                                             100.000 m
 Focal length of primary mirror, f                                 33.000 m
 Focal ratio of primary mirror, f/D                                 0.330
 Telescope F-number (or F/#): F_eff/D                               2.881
 Dish depth                                                        18.939 m
 Dish subtended angle                                             148.587 deg
 Subreflector subtended angle                                      19.837 deg
 Effective focal length, F_eff = M*f                              288.109 m
 Cassegrain telescope magnification, M = f2/f1                      8.731
 Eccentricity of the hyperboloid, e = c/a                           1.259

 Subreflector diameter, d                               8.000   9.000  10.000  11.000 m
 Height of secondary focus above paraboloid vertex, h   9.000   6.000   3.000   0.000 m
 Prime focus to hyperboloid vertex, f1 = c - a          2.466   2.775   3.083   3.391 m
 Secondary focus to hyperboloid vertex, f2 = c + a     21.534  24.225  26.917  29.609 m
 Secondary interfocal length, f1 + f2 = 2c             24.000  27.000  30.000  33.000 m
 Ray path difference to the foci, (f - h)a/c           19.067  21.450  23.834  26.217 m
 Dish edge angle as seen directly from secondary focus 78.757  75.491  72.318  69.254 deg
 Distance: prime focus – subreflector edge              4.155   4.675   5.194   5.713 m
 Subreflector depth at centre                           1.342   1.509   1.677   1.845 m
 Diameter of blind spot on subreflector                 0.598   0.757   0.935   1.131 m

              Ray tracing data

 Observing frequency [GHz] and wavelength                22.207 and 1.350 cm
 HPBW (beamwidth)                                                   0.539 '
 Assumed z-coordinate for aperture plane                          -23.530 m
 Number of rays traced                                               1300
 Number of pattern bins in u.v dimensions                          25.025
 Span of u coordinate [spacial cycles]                              5.000
 Span of v coordinate                                               5.000
 Free space illumination taper or asymmetry                         0.064 dB
 Feed illumination taper at the edge (Gaussian function)          -12.000 dB
|
        Some characteristics based on analytical solutions
   (classical optics approximation for Gaussian illumination, d = 10 m)

 Half power beam width (Baars 2003) ..............   0.0090          [deg]
 First side lobe power level due to taper (Baars)    0.5351            [%]
 Gain loss due to tapered illumination ...........  13.3611            [%]
 Gain loss due to diffraction at subrefl. (Lamb) .   1.0840            [%]
 Petzval surface radius (inverse field curvature)    2.8196            [m]
 Beam dev. due to primary translation (Baars) ....  -1.3160*Xoff/m   [deg]
 Beam dev. due to primary rotation ...............   1.7580*tilt/deg [deg]
 Beam dev. due to secondary translation ..........  -1.1193*Xoff/m   [deg]
 Beam dev. due to secondary rotation about vertex    0.1632*tilt/deg [deg]
 Beam dev. due to secondary rotation about focus .   0.1030*tilt/deg [deg]
 Beam dev. due to secondary rotation about "z_piv"   0.1030*tilt/deg [deg]
 Beam dev. due to feed translation in sec. focus .  -0.1967*Xoff/m   [deg]
 Feed offset per beam width, prime focus (Baars) .  -0.0068*NoOfBeams  [m]
 Feed offset per beam width, secondary focus .....  -0.0458*NoOfBeams  [m]
|
|
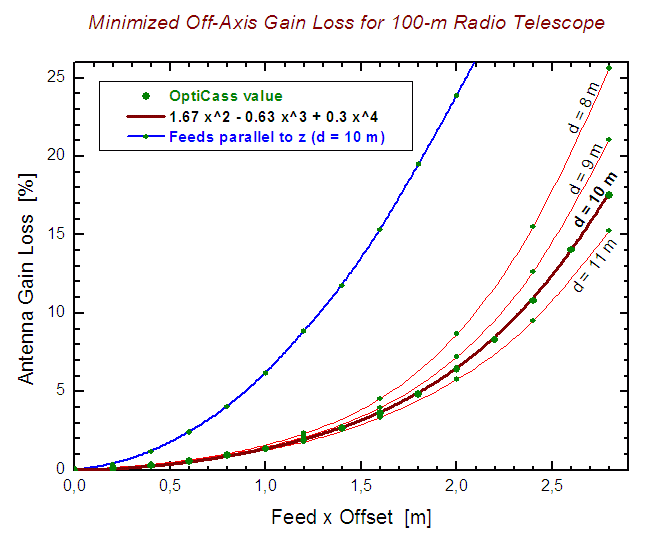
Fig. 1:
Minimum gain losses of symmetrical Cassegrain antenna as
a function of feed lateral offset from the secondary focus.
The minimum was searched for by varying the feed z coordinate
(along the telescope symmetry axis; see the next figure
for the amount of the z-shift required) and adjusting the feed tilt.
The four curves marked with 'd = ... m' correspond
to four different subreflector sizes (diameters, d) with
the height of secondary focus above the dish vertex
(h equal to 0, 3, 6 or 9 m for d equal to 11, 10, 9
or 8 m, respectively) chosen so as to maintain
the effective focal length constant (at 288.109 m).
The blue curve represents similar
losses assuming the feed direction is kept parallel to
the telescope axis of symmetry and for subreflector diameter
of 10 m.
Avalaible is also
a postscript version of this figure.
|

|
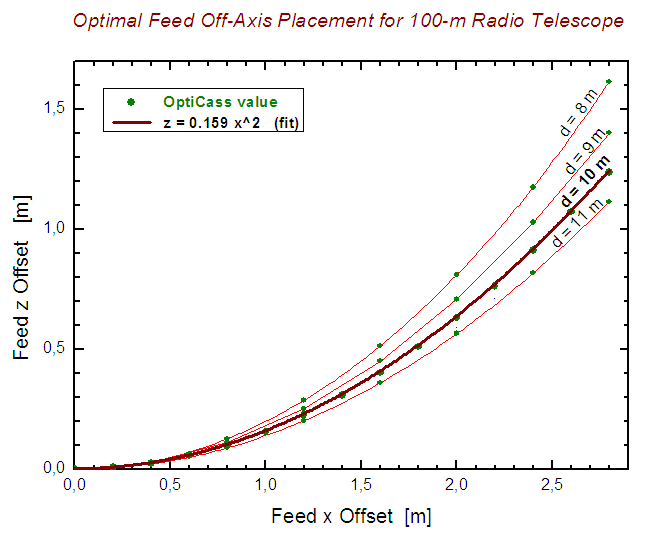
Fig. 2:
The height of feed above the secodary focal plane (towards
the subreflector) for which the least aberration and spillover
losses (shown in Fig. 1) are found while
simultaneously adjusting the direction of feed power pattern.
Avalaible is also a postscript version of this figure. |
The next table presents some data used for plotting Figure 1. and 2. In it,
the feed coordinates and its pattern direction (relative to direction towards
the subreflector vertex) are given in the first three columns (x, z
[in metres] and dtx [in degrees], respectively). The further five
columns contain losses [in percent of the antenna efficiency] due
to aberration (Aberr), spillover (Spill), aberration and
spillover together (A&S), illumination decentering (IllDec)
and the three losses together (Totl). In columns ComaLow and ComaHi
are given comatic distortions of
the power pattern (these are the minimum and maximum values of
the distortion pattern, i.e. the difference between patterns of the antenna
in question and one without the offsets) in percent of the pattern maximum.
The last column gives the level of the first side-lobe [in percent of
the maximum].
 x   z    dtx    Aberr  Spill    A&S    IllDec   Totl  ComaLow  ComaHi 1stLob
                            d = 8 m,   h = 9 m
0.0 0.000 0.000  0.0000 0.0000  0.0000  0.0000  0.0000  0.0000  0.0000 0.3417
0.4 0.031 0.116  0.0779 0.2853  0.3630  0.0000  0.3630 -0.1662  0.6659 0.5175
0.8 0.127 0.245  0.3942 0.6610  1.0525 -0.0134  1.0392 -0.3324  1.7048 0.7246
1.2 0.287 0.361  1.2628 1.0802  2.3293 -0.0522  2.2784 -0.5486  3.1284 1.0246
1.6 0.514 0.510  3.2298 1.3655  4.5511 -0.0565  4.4972 -0.6265  4.5356 1.5739
2.0 0.810 0.707  7.0319 1.7598  8.6680 -0.1025  8.5743 -0.6536  7.1470 2.4879
2.4 1.175 0.981 13.7486 2.0553 15.5213 -0.0106 15.5124 -0.6894 11.7671 4.2588
2.8 1.615 1.167 23.7469 2.4599 25.6226 -0.1414 25.5175 -0.4129 17.9269 8.0506
                            d = 9 m, h = 6 m
0.0 0.000 0.000  0.0000 0.0000  0.0000  0.0000  0.0000  0.0000  0.0000 0.3417
0.4 0.027 0.109  0.0767 0.2548  0.3313  0.0034  0.3347 -0.2004  0.5929 0.5336
0.8 0.112 0.204  0.3716 0.6053  0.9747 -0.0095  0.9653 -0.4001  1.5400 0.7586
1.2 0.252 0.319  1.1059 1.0248  2.1193 -0.0473  2.0731 -0.5519  2.9224 1.0364
1.6 0.451 0.454  2.7599 1.2499  3.9753 -0.0278  3.9486 -0.7268  4.1313 1.4477
2.0 0.708 0.620  5.6898 1.6293  7.2264 -0.0810  7.1512 -0.6666  6.1401 2.2383
2.4 1.028 0.821 10.8656 2.0028 12.6508 -0.1092 12.5554 -0.7353  9.7548 3.5975
2.8 1.401 1.179 19.3196 2.1450 21.0502  0.3300 21.3107 -0.6220 15.4302 6.1827
                            d = 10.0 m, h = 3 m
0.0 0.000 0.000  0.0000 0.0000  0.0000  0.0000  0.0000  0.0000  0.0000 0.4093
0.4 0.025 0.095  0.0771 0.1954  0.2723  0.0086  0.2809 -0.3096  0.4404 0.5608
0.8 0.100 0.174  0.3518 0.6092  0.9589 -0.0128  0.9463 -0.3841  1.5148 0.8596
1.2 0.225 0.279  1.0344 0.8815  1.9068 -0.0096  1.8974 -0.7596  2.5336 1.1320
1.6 0.401 0.409  2.4208 1.2340  3.6250 -0.0379  3.5884 -0.7427  3.8756 1.5318
2.0 0.630 0.537  4.9695 1.5195  6.4135 -0.0367  6.3791 -0.7755  5.4899 2.2102
2.4 0.911 0.717  9.1075 1.8538 10.7925 -0.0546 10.7437 -0.8067  8.3873 3.2825
2.8 1.236 1.021 15.7083 2.1534 17.5234  0.1038 17.6091 -0.7179 13.0932 5.2617
                            d = 11 m, h = 0 m
0.0 0.000 0.000  0.0000 0.0000  0.0000  0.0000  0.0000  0.0000  0.0000 0.5615
0.4 0.022 0.093  0.0765 0.1949  0.2713  0.0094  0.2806 -0.3048  0.4326 0.6676
0.8 0.089 0.162  0.3439 0.5336  0.8756 -0.0021  0.8735 -0.4482  1.4153 0.8905
1.2 0.202 0.257  0.9519 0.8507  1.7945 -0.0118  1.7829 -0.7427  2.4706 1.1957
1.6 0.360 0.351  2.1511 1.2426  3.3670 -0.0608  3.3083 -0.7181  3.7217 1.5565
2.0 0.565 0.483  4.4234 1.4113  5.7723 -0.0147  5.7585 -0.8793  5.0427 2.2095
2.4 0.817 0.630  7.8702 1.7819  9.5118 -0.0387  9.4768 -0.9021  7.4399 3.2484
2.8 1.115 0.848 13.5184 2.0114 15.2578 0.0875 15.3319 -0.8425 10.8538 4.8181 |
The tolerance is gradually increasing towards lower frequencies
(i.e. the longer waves the smaller total gain lost and the smaller
losses per unit feed displacement). At 5 GHz
(wavelength of 6 cm) at the secondary focus the z-error of 6 cm
results in only 0.065 % gain loss. For the feed position at x = 2.8 m
and z = 1.25 m (about optimum 'z' there, with a minimum of gain losses
of about 3.2 %) the rate of gain degradation is slightly smaller than
at the focus and is about 0.01 % per
1 centimetre error in the z-coordinate (upward or downward).
Posted on January 11, 2010, by KMB
Last updated: January 19, 2010