Report presented at the OCRA Workshop, Torun, 10–12 July 2006.

About Performance
of 32 m Radio Telescope
with OCRA Arrays


K.M. Borkowski
TRAO, Centre for Astronomy, NCU, Torun, Poland

This is an update to previous year's report at similar Workshop. Although large portions of that report have been presented again at this Workshop, I limit this web version to those points that were updated. The main conclusion of this contribution is that for OCRA project, with array size demending placement of feeds beyond about 20 cm off the telescope axis, the curvature of RT32 focal surface and orientation of horns get increasingly important to become possibly a challenge for designers of the full fledged project.


Pointing Lookup Table


Corrections of nominal coordinates presently are done every 2° of azimuth and zenith distance using lookup table composed of corrections computed from the Model3 for odd number of degrees of the coordinates.

No interpolation:

largest errors in pointing at knots of even values of the coordinates expressed in integer degrees.

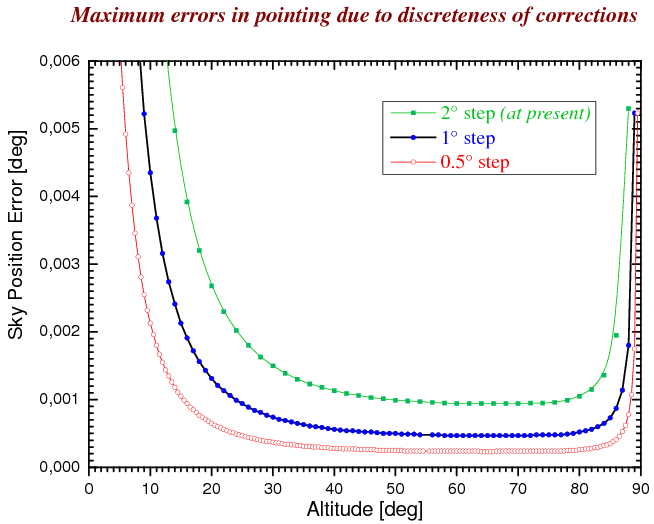
The green symbols on the plot below show the largest value of position errors (composed of errors in the two coordinates added quadratically) of all knots at each even degree of elevation (the missing off-scale errors for elevations close to horizon can be inspected in this complete figure of the previous report).

Largest errors in pointing due to sampling of Model3
every 2° (now implemented), and 0.5° (new control system)

Presently this pointing error does not exceed 0.001° for altitudes 50 to 78°.
With 0.5° step the error will not exceed 0.001° for altitudes 15 to 88°.

Note: The higher errors at low elevations are due to rapid increase of corrections in zenith distance as one approaches the horizon. On the other end, for larger errors near the zenith responsible become fast growing corrections in the azimuth coordinate.
Shape of Focal Surface


Earlier computations demonstrated that for optimally positioned OCRA-f (about 9 mm above the focal plane) the outermost feeds (18 cm off the telescope axis) will suffer negligible power losses due to aberration and spillover (about 0.2 %) and acceptable losses due to fixed direction of horns (about 3 %). Those computations assumed the parabolic on pedestal illumination function while the OCRA feeds radiation patterns are known to match very well the Gaussian function with 12 to 13 dB taper. For the small array size discussed earlier the form of the illumination function does not make significant difference, but is important for larger offsets.


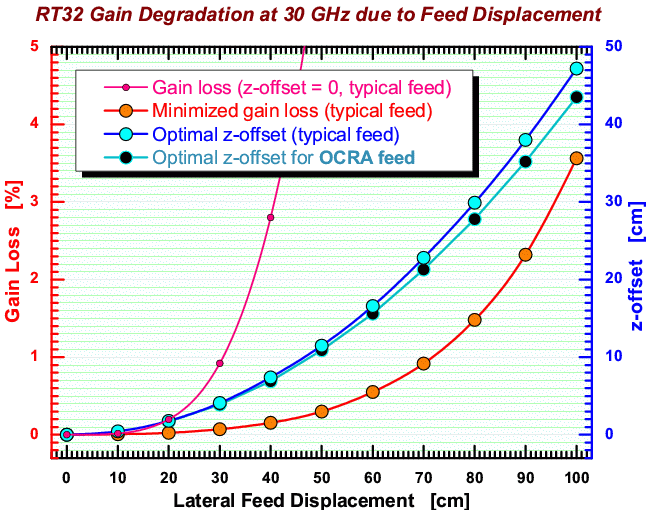
Wavefront aberration losses in antenna gain as a function of lateral displacement of feeds computed for the RT32 optics and observing frequency of 30 GHz. The thinner pink curve shows the losses with feeds kept at the level of nominal focal plane, i.e. without refocusing, while the thick red curve (lowest one) represents the minimum loss when the feed z-coordinate and its direction of radiation pattern are adjusted. The amount of the refocussing required is shown as the blue curve; it corresponds to optimally directed feed illumination pattern (i.e. roughly towards the centre of subreflector).
The black dots represent also z-offset of optimal surface but computed specifically for the OCRA feeds: Gaussian illumination function with 12 dB taper, and fixed direction of its maximum (parallel to the telescope axis). For this case the losses in antenna efficiency (which include the effects of aberration,
  x   z   Aberr  Spill Eccentr   Total
 cm  cm     %      %       %       %
 10  0.4 0.0062 0.1512  0.5374  0.6939
 20  1.7 0.0267 0.3237  2.0679  2.4109
 30  3.9 0.0666 0.5141  4.4703  5.0247
 40  6.9 0.1387 0.6693  7.9322  8.6753
 50 10.9 0.2511 0.8322 12.0103 12.9616
 60 15.6 0.4333 0.9549 17.4752 18.6174
 70 21.3 0.6806 1.1396 23.2130 24.6047
 80 27.8 1.0312 1.3294 29.8366 31.4832
 90 35.2 1.4960 1.5673 36.8082 38.7292
100 43.5 2.1107 1.8462 44.5100 46.6841
 
spillover and illumination function eccentricity) are dominated by eccentric illumination of the main dish. E.g. at x-offset of 50 cm, being the least loss possible it is already as high as 13 % of which 12 % comes from the mentioned effect (see the table on the left and also material in the next section).
Remark:
the many digits in numerical results of this table and elsewhere in this document do not represent their accuracy but are rather meant to serve as a possible reference for future checks by independent users of our OptiCass program or other software.


Losses and Pattern Deformation


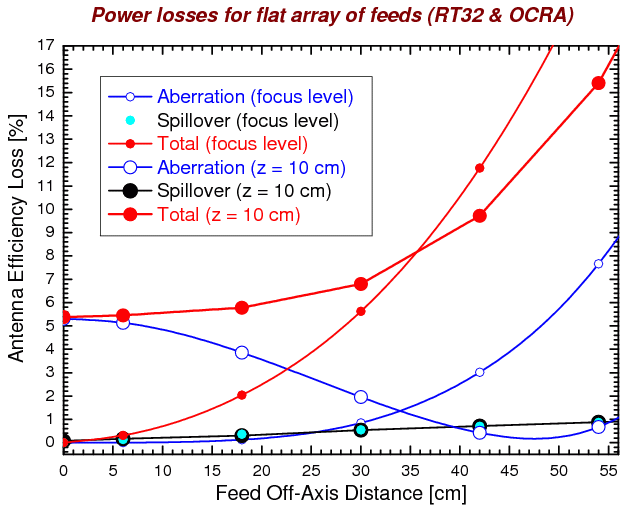
Aberration (caused by uneven phase on the aperture), spillover (rays missing the dish) and total losses for RT32 telescope with flat array of feeds placed at the secondary focus and 10 cm above it. The total loss includes the two losses drawn plus the effect of eccentric illumination. From numerical data (see Table below) one easily notes that this effect, the asymmetry in amplitude distribution on the aperture due to parallelism of horns, quickly becomes the largest component of the total losses and that this component is rather weakly sensitive to the z-coordinate adjustments.

These data were computed with the OptiCass software using its maximum available power (in terms of rays traced, i.e. 68 points on the dish radius which means about 15000 rays) and Gaussian illumination function (assuming 12 dB taper at the dish edge and direction of maximum parallel to the telescope axis). Click on this image to see a similar figure but with results for the 12 dB parabolic on pedestal illumination function (the one that has been presented at the Workshop).

Table: Losses calculated for a flat OCRA array of feeds placed at two levels:
in the focal plane and 10 cm above it (toward the prime focus). The column designations are:
x_off - distance of the feed from telescope optical axis,
Angle - angle between feed pattern direction and direction to subreflector centre,
Aberr - loss due to nonuniform ray path lengths to aperture plane,
Spill - loss due to rays missing the dish,
Eccentr - loss due to eccentric illumination function,
Total - the above three losses combined.

     |           z_off = 0.0cm              |           z_off = 10.0cm
x_off|  Angle   Aberr  Spill Eccentr  Total |  Angle  Aberr  Spill Eccentr  Total
 cm  |   deg      %      %       %      %   |   deg     %      %       %       %
  0  |    0       0      0       0      0   |    0   5.3080 0.0724  0.0000  5.3766
  6  | 0.3759  0.0038 0.1355  0.1730  0.3121| 0.3800 5.1313 0.1694  0.1643  5.4476
 18  | 1.1286  0.1264 0.3636  1.5536  2.0354| 1.1400 3.8766 0.3833  1.5658  5.7444
 30  | 1.8787  0.8444 0.5463  4.3016  5.6280| 1.8995 1.9672 0.5657  4.3558  6.7677
 42  | 2.6293  3.0165 0.7067  8.3781 11.7698| 2.6583 0.4283 0.7254  8.4887  9.5416
 54  | 3.3790  7.6664 0.8652 13.6418 20.9522| 3.4163 0.6625 0.8845 13.8374 15.1653
 66  | 4.1275 15.6052 1.0406 19.9074 33.1094| 4.1730 4.2034 1.0585 20.2554 24.4160

Note: As seen in this table, for 100-feed array the difference in total loss between the outer (54 cm off the axis and not 66 cm!) and inner feeds is about 10 % (for 66-cm offset it would be about twice as big!).


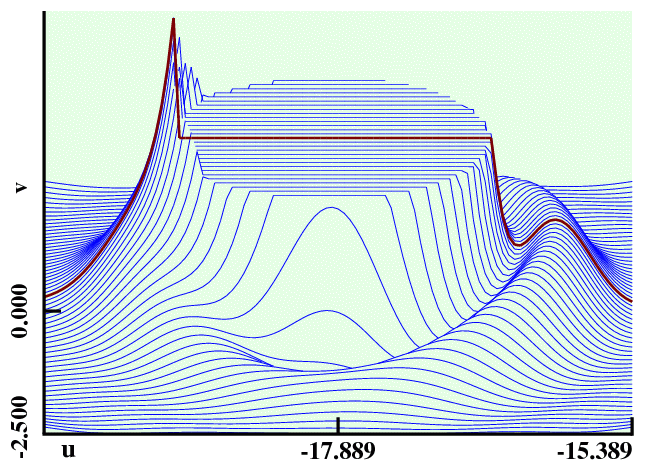
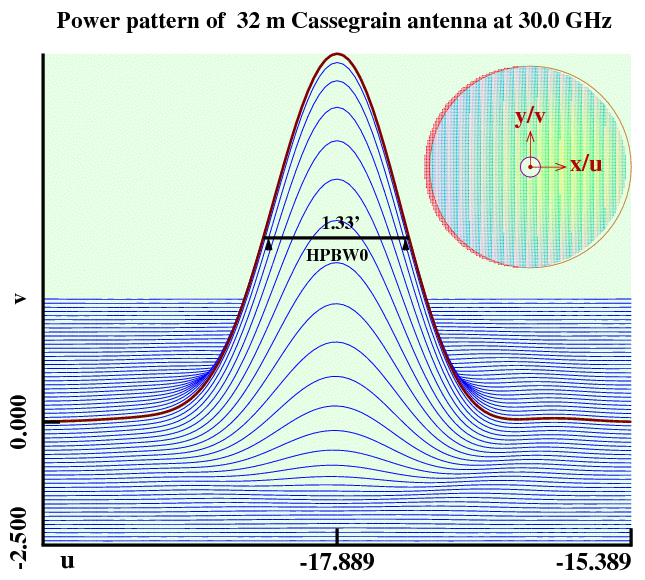
32 m antenna pattern at 30 GHz for a feed with parallel radiation pattern placed 54 cm off-axis and 10 cm above the focal plane. It has been generated with denser sampling on spacial frequencies plane than in case of tabular data (here it is an array of 101 × 61 u × v points while the tabular data, for speed of computation, were limited to 25 × 13 point array). Inset shows amplitudes and phases of all the rays on the aperture plane (red color indicates rays lost behind the dish edge or those with weight zeroed). The Gaussian illumination function with 12 dB taper was assumed (click on the image to see similar figure computed for 12 dB parabolic on pedestal illumination function and the offset of 66 cm that has been presented at the Workshop). The brighter area near to the right arrow tip represents the shifted maximum of amplitude distribution. Further explanation to these figures can be found in this descriptive text on OptiCass.


Bottom part of the same pattern rescaled and with main beam cut out at 2 % of main lobe power at its maximum. Note the first side-lobe on the right which is about 1.1 % high.


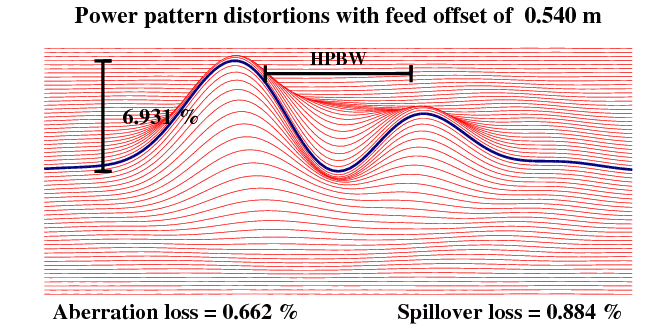
Distortions of the power pattern shown above relative to an offset-free pattern (i.e. after subtraction of a pattern computed for the same feed but placed in the secondary focus).


Example of OptiCass output for Gaussian illumination function and outer feed 10 cm above
focal plane. The last but one line contains the discussed losses (for interpretation of other content click on this link). Note differences as compared to corresponding data of
Table which are due to assumed different resolutions on u-v plane.
       SETTABLE parameters             #     #0      #1      #2      #3      #4
Cassegrain: D,X_min,f,Xs_max,h2   [m]  0  32.000 -16.000  11.200   1.600   1.000
Subreflector: x,y,z,  tx, ty  [m,deg]  1   0.000   0.000   0.000   0.000   0.000
Feed offsets: x,y,z, Dtx,Dty  [m,deg]  2   0.540   0.000   0.100   3.416   0.000
Ray-tracing: N/R.NxNy,Nu,Nv,maxU,maxV  3  68.0000 100.    60.      2.500   2.500
Wavel,Taper,zAprt,pltD,pivot [m,dB,-]  4   0.010 -12.000  -8.343   2.     -1.

       COMPUTED param's  & x,z_piv,du,v,N  0.000   0.480   0.009   0.000   1.000
Main dish: f/D,f/Dp, D2, G,coordG [m]  6  0.3500  0.3500  32.000   5.714  16.000
 angles: t_V,t_H, t_0, t_1, t_2 [deg]  7 142.151 142.151   0.000 -71.075  71.075
Subreflector: Dc,Dm,Ds2,Gs,Xs_min [m]  8  3.2000  3.2000  3.2000  0.5056 -1.6000
 feed angles: t_VH,t_c,_0,_1,_2 [deg]  9 18.8256  0.0000  0.0000 -9.4128  9.4128
Cassegrain: f1, f2, fs, F,   M  [m,-] 10  1.0541  9.1459 10.2000  97.173  8.6762
Hyperbola: a,c,b,e,  FSAmpRatio [m,-] 11  4.0459  5.1000  3.1050  1.2605  0.9933
Beam: t_u,t_v,     HPBW_u,_v,_0 [deg] 12 -0.3203  0.0000  0.0222  0.0212  0.0208
  Squint, phi_X,Y, apert_X,Y  [deg,m] 13  0.3203 -3.4163  0.0000 -0.6052  0.0000
Loss: Aberr,Spill,A&S,IllDec,Totl [%] 14  0.6617  0.8845  1.5404 13.8374 15.1647
  pathR,ComaLow,-Hi,1stLob,Totl'[m,%] 15  0.1771 -0.0991  6.9312  1.0574  7.312


KMB (kb@astro.uni.torun.pl)     Last updated 2006.07.18