|
All-Sky Search II
of EXPLORER Data |
This site presents an all-sky search for gravitational waves from spinning
neutron stars in data from the
EXPLORER bar detector. This is a continuation
of the work done recently. We perform an all-sky
search using a two-day stretch of data disjoint from the two-day stretch
that was analysed in the previous search.
The analysis is done on the basis of Memorandum of
Understanding between
the ROG Collaboration and
Institute of Mathematics of Polish
Academy of Sciences and also through an agreement between the Rog Collaboration
and the Virgo Project group in Rome.
The search is done using the computers provided by the Virgo Project.
One of the aims of this search is to estimate the computing time needed
for a fully coherent all-sky search using the data of a narrow band
detector as the test data.
The results of the search will be compared with those of an analysis done
using the hierarchical search
procedure, developed by the Virgo group of Rome, in collaboration with
the ROG group.
The parameters of the analysis are as follows.
Parameters of the data:
The Modified Julian Date of
           the first sample:   48590.32210
Length of observation time:    2 days
Sampling frequency: 1.5212 Hz |
Parameters of the search:
Bandwidth of the search: 920.9992 – 921.7598 Hz No. of Fourier bins 219 = 512000 Spindown range: –9.1762 10–8 – +9.1762 10–8 Hz s–1 No. of spindowns 2868 Sky positions: All sky No. of pointings 31915 |
In Rome there are six 2-processor computers:
virgofarm2, virgofarm4, virgofarm5, virgofarm6, virgofarm7, virgofarm8
| O.S.: Linux RH 8.0 (kernel 2.4.18-14) CPU: 2 Intel Xeon 2.4GHz RAM: 1GB L2 cache: 512KB |
In Bologna there are seven 2-processor computers:
wn-04-35-a, wn-04-34-a, wn-02-33-a, wn-02-34-a, wn-02-06-a,
wn-01-22-a, wn-01-23-a
| O.S.: Linux RH 7.3 (kernel 2.4.18-3) CPU: 2 Intel Xeon 2.2GHz RAM: 2GB L2 cache: 512KB |
The data analysis tools that we use in this search are presented in the paper "Data analysis of gravitational-wave signals from spinning neutron stars. IV. An all-sky search" by Astone, Borkowski, Jaranowski and Krolak, Phys. Rev. D 65, 042003 (2002) (here is a preprint).
SEARCH PROGRESS REPORT |
|
Highest signal-to-noise of a candidate
| |||
Graphical presentation


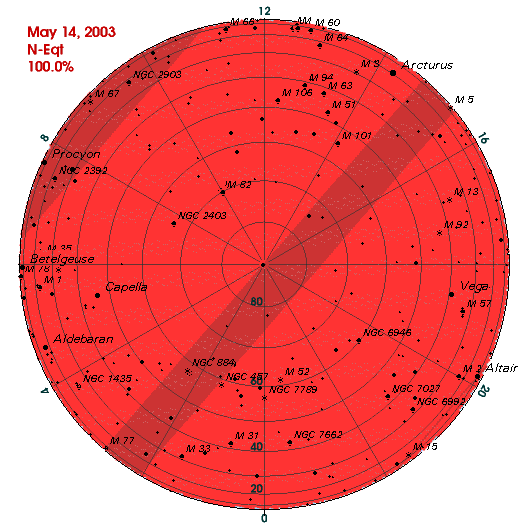
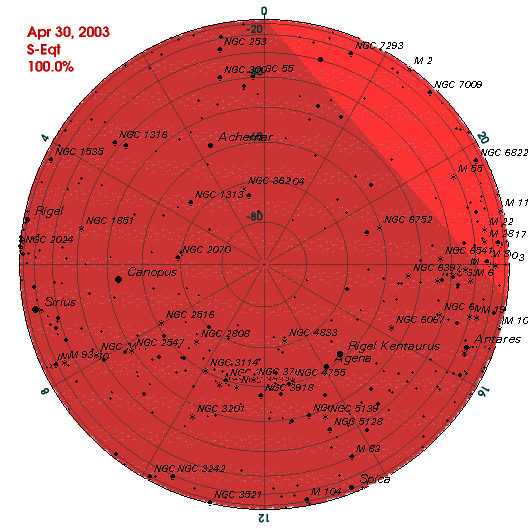
The above pictures are a flat representation of the heavenly sphere
north (upper picture) and south (the lower one) of the celestial equator.
They are given in the so called parallel projection (in which the radial
distance is mapped as the cosine of declination).
The right ascension
coordinate, measured in hours (0 to 24), has the origin at the bottom
(marked with a 0) of northern hemisphere and is there
clockwise positive. On the southern hemisphere the top point concides
with the origin of the right ascension, which is measured counterclockwise.
The declination circles are drawn every 10 degrees, outermost circle
or the celestial equator corresponding to 0 degrees.
On these maps
areas already searched in our project are shown by dark and light red dots.
These two shades of red correspond to different phases of the search.
In this particular projection the dots cluster to form straight strips.
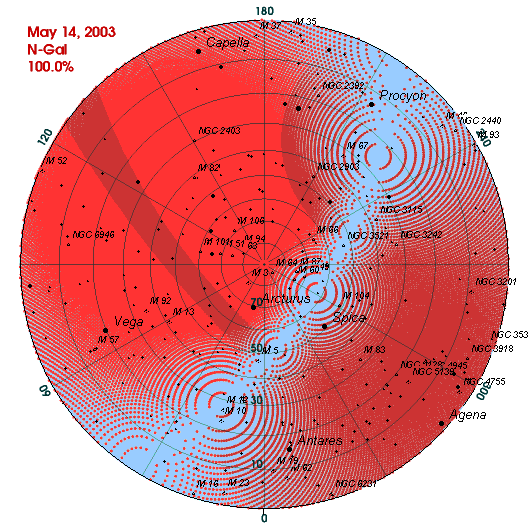
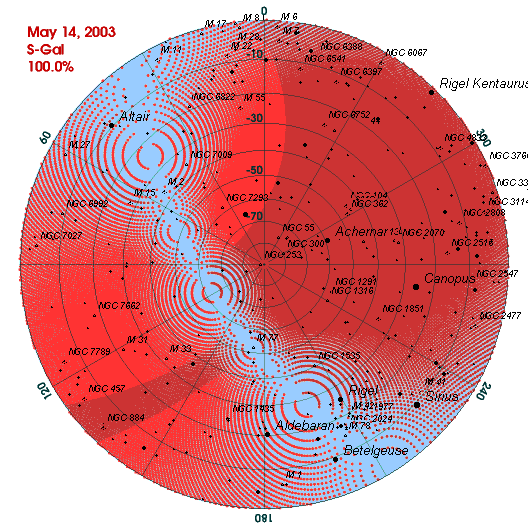
The same data superimposed on sky maps in different
projection and in the galactic frame of coordinate reference are given
below. Here both the galactic hemispheres are shown in the 'conic'
projection in which the radial distance is mapped as
cosb/(1+sin|b|),
b being the latitude.
The upper picture corresponds to the northern and the lower to
the southern half of the sphere.
The galactic poles are at the circle centers and the galactic longitude
is counted clockwise from 0 to 360 degrees (at the bottom) on
the northern hemisphere. The southern half has this coordinate with
the origin at the top and counted counterclockwise. The latitude
circles are drawn every 10 degrees. As in the case of equatorial
coordinates, areas already searched in this project are depicted by
dark red and light red dots corresponding to different stages of
the progress.


Perhaps it is worth reminding that the center of
our Galaxy is located at the origin of galactic coordinates, i.e.
at the bottom point of the top image and at the top of the other one,
while the galactic equator coincides with the outermost latitude
circle (i.e. the disk edges) of both the hemispheres.
These composite images were obtained by merging plots of the grids
and progress dots with maps created separately with the help of
another program, a useful freeware
StarCalc, v. 5.6,
by Alexander Zavalishin.
| The search has finished on May 14, 2003 !!! |