The data sample
The 2-day stretch of data that we analyse in our all-sky search
is taken from a larger continuous set of data of almost 13 days.
UTC Time of the first sample of this set is
19th November 1991 11:12:56 corresponding to Modified Julian Date
of 48579.4673148148 and UTC Time of the last sample is
2nd December 1991 7:35:57 corresponding to Modified Julian Date
of 48592.3166319445.
The plots below represent strain sensitivity
(square root of two-sided power spectral density) of the data.
[Click on an image to see it in higher resolution.]
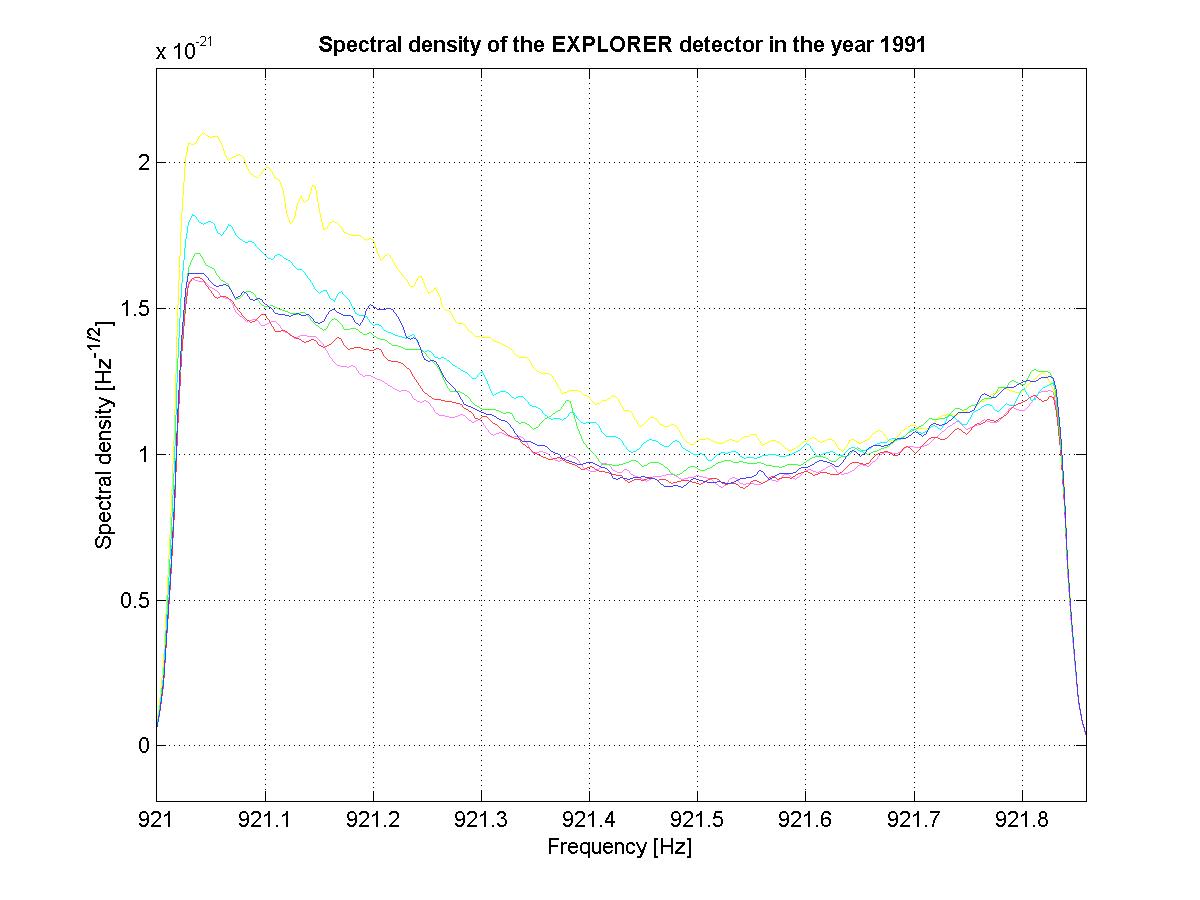
Plots of the strain sensitivity of consecutive 2-day stretches
of data from the 13-day run. You can appreciate the stationarity
of the data. Remember plots are on the linear and not on the
usual log scale. Spectral density falls at the edges of
the bandwidth because of the smoothing filter applied in
the frequency domain.
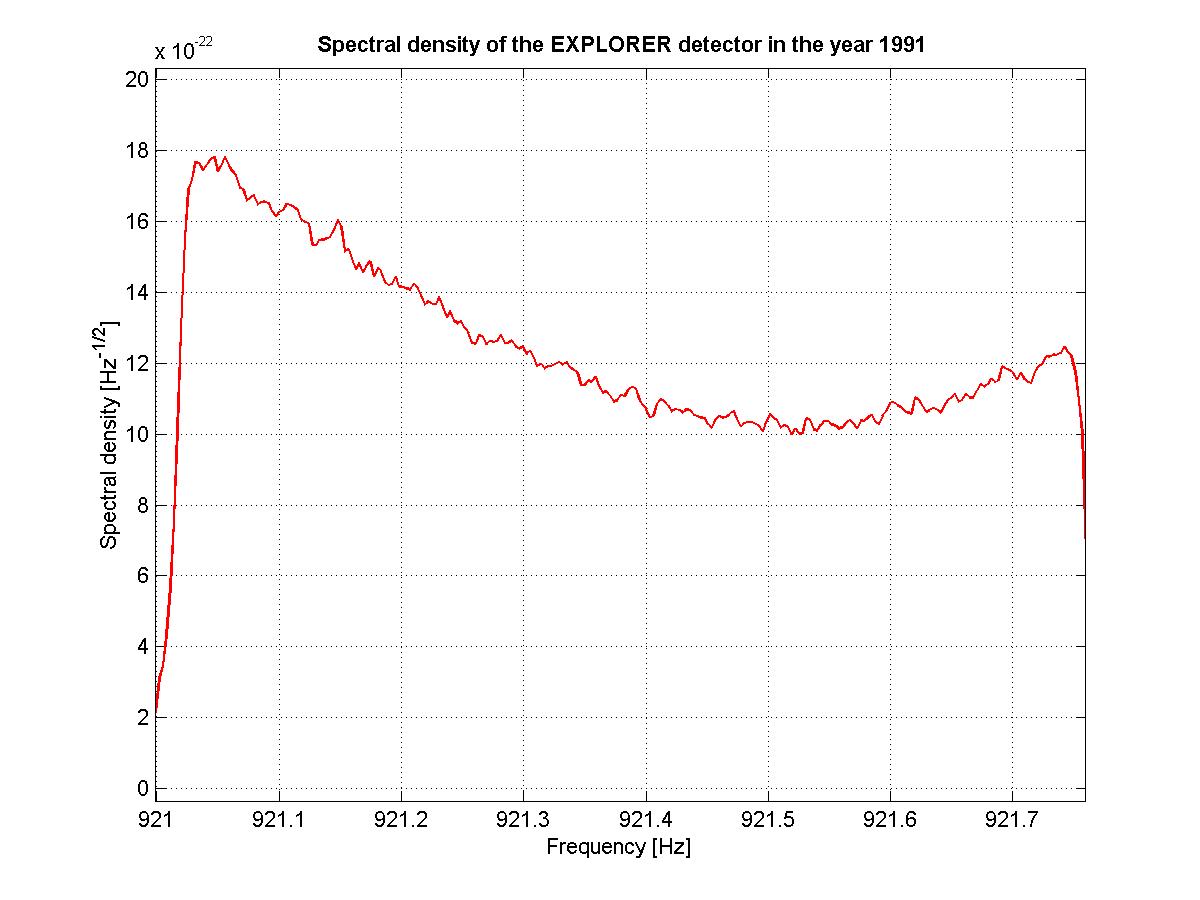
Plot of the strain sensitivity of the 2-day stretch of data chosen from
the 13-day run that we analyse in our all-sky search.