(Last updated: 2004.04.06)
This chapter deals with programming tools developed for steering of the 32 m radio telescope (here referred to as RT32 or RT-4) and its various components as well as for monitoring of their state.
III.1 Controlling the Motion
The steering system consists of number of tasks cooperating with each other and residing in computers of variety of class. Among the computers involved a leading role plays an industrial computer of the PC/486 class run under the DOS operating system. It is located in the electrical cabin (at the base) of the RT32 and is connected with other computers (controllers) with optical fibres.The c:\rt4\new\rt4.exe program is automatically executed with every start of this main computer. It initiates a communication with the controllers of angle converters of the dish position as well as the controller reading the position of the subreflector, sets proper parameters in the FESTO and Lence drivers controllers, initiates the network communication, starts a user graphical interface, and receives commands sent from the console and from the network.
 |
| Entire screen of the operator's monitor |
In the control room an HP745i (trao2) computer with the HP-UX 10.01 operating
system plays the server role for the steering system. This workstation is
connected to a separate branch of the Ethernet network, that links the
telescopes with the control room, with an extra Ethernet card (EISA).
The comminication with the telescopes is carried on the level of link layer
within a seven layer network communication model of the OSI.
The following programs perform specialised tasks.
rt4link — communicates with the RT32. It sends commands
to the computer in the electric cabin (the lower one) and receives RT32
control parameters. These parameters are stored in the shared memory of
the trao2 computer. From here these data can be accessed by other programs.
The rt4link reads only primitives, basic parameters and computes
the remaining useful parameters.
rt4win — displays some of the telescope parameters in
a scalable window.
rt4gov — is responsible for the user commands delivery to the
rt4link program.
rt4load — reads commands from a prepared file and supplies
them to the rt4link program.
rt4diag — displays diagnostics.
rt4lenze — displays one of parameters of the Lenze controllers
in a window of the X-windows.
Running and closing of the programs
An operator, sitting at the envizex or trao3 terminal (with the Linux operating system), logs onto trao2 as the oper user and runs the| rt4 |
 |
 |
 |
|
Fig. III.1: Monitoring windows: RT4 with time data, current
and preset telescope direction (sky coordinates) and the Cassegrain mirror
position (top panel), one of parameters of the Lenze drives (middle panel), and some diagnostics (bottom panel) |
•
RT4 — shows time and sky coordinates,
•
Lenze par. 056 — displays the parameter No 56 (this number is settable)
of the Lenze drives,
•
RT4 Diagnostics — serves to display requested diagnostic information,
•
RT4 Command Module — allows for 'manual' control of the telescope position
and motion.
 |
| Fig. III.2: RT4 Command Module window is used for keying in of the steering commands |
Further to the above, opened are also these windows:
•
Signal Monitor — plots the signal from one of eight channels,
•
VXI Command Module — allows to send commands to the system of
data acquisition,
•
Receivers Command Module — with this window one can exercise control
over receiver systems.
To close all these control programs one need to execute
| kill_all |
Steering commands
Control of the antenna motion| epoch E | — set the source coordinates epoch to E (most frequently E=1950.0 or E=2000.0) |
| ps α δ | — go to and track the sky point with the right ascension α [degrees or hours] and declination δ [degrees]; these angles can also be given in the form 00h00m00.0s and/or 000d00m00.0s |
| ps c=name | — go to and track the source name using data from the current catalogue |
| poh Δa Δz | — offsets in the azimuth a and zenith angle z in degrees relative to the source position (α,δ) |
| poe Δα Δδ | — offsets in the right ascension α and declination δ [degrees] relative to the current direction (α,δ) |
| pod | — cancel the offsets (set them to zero) |
| scan n1 n2 | — scan a rectangular area about the point (α,δ), defined by earlier chosen offsets (set with the command poe or poh); n1, n2 are numbers defining the scan velocity (presently determined experimentally) |
| roh | — show current offsets in a and z due to off-axis placement of the feed of the receiving system |
| roh name | — apply the name feed values to the above offsets; name can be set to: 18cm, 6cm or 5cm |
| roh name Δa Δz | — assign these offsets to the name feed (this command is reserved for the use of the steering system manager!) |
| cor | — display the name of the current correction table and the current correction values |
| cor name | — use the name correction table; presently the name can assume: none (no corrections), rf (corrections determined by RF) or rfnew |
| pp a z | — move to the (a,z) coordinates [degrees] |
| pd | — stop the antenna |
| va v | — set the azimuth speed to v [number of motor revolutions per minute] |
| vz v | — set the zenith distance speed to v [number of motor revolutions per minute] |
| vd | — set the speed in both the axes to 0 [rev./min.] |
FESTO driver terminal
Remark: Commands of the FESTO driver concern motions of the Cassegrain subreflector as well as power supplies in the secondary focus cabin. They are intended exclusively for maintenance purposes. It is forbidden to use them during normal observational work! Each command beginning with the festo word results in passing of its argument to the FESTO controller. Usually the commands are of the form festo mr0.100=$Nr. A response is printed in the RT-4 Command Module window. A few examples of these commands pertaining to movements of the secondary mirror follow.
| festo mr0.100=$50 | — switch off all movements |
| festo mr0.100=$52 | — X — move to the left |
| festo mr0.100=$53 | — X — move to the right |
| festo mr0.100=$54 | — Y — move to the left |
| festo mr0.100=$55 | — Y — move to the right |
| festo mr0.100=$5a | — A — move to the left |
| festo mr0.100=$5b | — A — move to the right |
| festo mr0.100=$5c | — B — move to the left |
| festo mr0.100=$5d | — B — move to the right |
Logging parameter values
| lf file | — open a work file file |
| no adr par | — save the parameters par from the Lenze drive adr to the work file |
| nod | — terminate the saving |
Using catalogues
| ncat n | — make the catalogue No n
[0 to 9] current. Presently available are: n = 0 — general catalogue (assumed at the start) n = 1 — pulsar catalogue n = 2 — OH source catalogue |
| cat sname epoch α δ | — add the source by name sname to the current catalogue |
| show sname | — display data of the sname |
| alias sname1 sname2 | — add another name (sname2) to the source sname1 |
Other commands
| ct s | — add s seconds to the universal time kept by the system |
| zo n | — enable (normally blocked) movements
in a zone of extreme switch; this allows to position the telescope for maitenance purposes: n = 1 with the dish in the lower extreme position n = 2 with the dish in the upper extreme position n = 3 with the dish in the left of meridian extreme position n = 4 with the dish in the right of meridian extreme position |
| zod | — disable the movements (enabled by the zo n command) |
| xzero | — insert the offsets
Δa and Δz
into a correction register of the base position (normally not to be used!) |
| lenze n | — display the parameter No n [0 < n < 250] in the Lenze window |
III.2 Controlling the Receivers (rec)
The main computer for receivers control is an industrial PC/486 machine in the secondary focus cabin. It controls the HP 83711A frequency synthesizer that generates signals up to 100 mW in power in the range 1 to 20 GHz. Commands received from optical Ethernet are executed by the gen.exe program.In the control room an HP745i (trao2) computer with the HP-UX 10.01 operating system plays the server role for the steering system. This workstation is connected to a separate branch of the Ethernet network, that links the telescopes with the control room, with an extra Ethernet card (EISA). The comminication with the telescopes is carried on the level of link layer within a seven layer network communication model of the OSI.
The reclink program sets up a communication with the computer
in the secondary focus cabin, sends commands and receives responses.
The recgov program is responsible for the Receivers Command Module window, where commands can be keyed
in and responses are displayed.
Steering commands: frequency sinthesizer, phase calibration signals, and dewars control
| sl | — L band synthesizer will be controlled |
| sc | — C band synthesizer will be controlled |
| lop | — display the local oscillator (LO) signal power [dBm] |
| lop n | — set the LO power level at n dBm |
| lof | — display the LO frequency [GHz] |
| lof f | — set the LO frequency to f GHz |
| ref | — display type of signal source [internal/external] |
| status | — display the synthesizer state |
| pcal | — display state of the phase cal [0/1] |
| pcal 0 | — switch the phase cal off |
| pcal 1 | — switch the phase cal on |
| dewar 1 | — display the diode voltage in the L band receiver |
| dewar 2 | — display the diode voltage in the C1 band receiver |
| dewar 3 | — display the diode voltage in the C2 band receiver |
| dewar 4 | — display the diode voltage in the C2 band receiver (second level) |
| latt 0 | — switch off an attenuator in the path of the L band amplitude calibration |
| latt 1 | — switch on an attenuator in the path of the L band amplitude calibration |
| catt 0 | — switch off an attenuator in the path of the C1 band amplitude calibration |
| catt 1 | — switch on an attenuator in the path of the C1 band amplitude calibration |
| cfilter 0 | — switch off the mirror filter for 4.3 – 4.9 GHz of 6 cm receiver (C1 band) |
| cfilter 1 | — switch on the mirror filter for 4.7 – 5.3 GHz of 6 cm receiver (C1 band) |
 |
| Receiver command window |
Intermediate frequency distribution
The intermediate frequency distribution module is in the secondary focus cabin. It has 8 inputs (numbered 0 to 7) and 4 outputs corresponding to cables traditionally marked A, B, C, and D. Each output can be connected to one of two inputs.Presently the outputs are settable according to the scheme given below:
| 0 system L | LCP i = 0 ř | |
| output A | ||
| 1 system K (X) | LCP i = 1 ö | |
| 2 system L | RCP i = 0 ř | |
| output B | ||
| 3 system K (X) | RCP i = 1 ö | |
| 4 system C1 | LCP i = 0 ř | |
| output C | ||
| 5 system C2 | LCP i = 1 ö | |
| 6 system C1 | RCP i = 0 ř | |
| output D | ||
| 7 system C2 | RCP i = 1 ö | |
 |
| Fig. III.3: Block diagram of the intermediate frequency distribution (AKę) |
The distribution module amplifies input signals and allows for correction of their frequency passband shape. The amplification can be reduced (by setting the level of attenuation) in the range 0 to -15 dB. The passband shape is modified through change of a varactor capacity done with the voltage generated by an 8-bit DA converter. This procedure effectively reduces the amplification in a lower part of the intermediate frequency band (near 500 MHz).
There are four one-argument commands, and four three-argument commands
available for frequency distribution control. These are:
- 1A — display current connection of the A output
1B — display current connection of the B output
1C — display current connection of the C output
1D — display current connection of the D output
1A i a s — connect the A output to the i input,
attenuate the signal by a dB, and set the band slope to s
1B i a s — connect the B output to the i input,
attenuate the signal by a dB, and set the band slope to s
1C i a s — connect the C output to the i input,
attenuate the signal by a dB, and set the band slope to s
1D i a s — connect the D output to the i input,
attenuate the signal by a dB, and set the band slope to s
III.3 VXI Command Module Window
 |
The VXI Command Module window accepts
the following commands:
| vxical | — perform the internal VXI calibration of converters; use this command in case of weird signal data |
| range N | — sets the range of voltage; user may enter any number for N, but the VXI will pick one of 2, 4, 16, 32 and 64 V that is closest to the requested value |
| period Δt | — sets the signal sample spacing to Δt s; user ma enter any number of seconds with the pecision of 0.1 s |
| cal Δt | — switch the noise diode on for Δt integer seconds (for calibration purposes); cal 0 switches the diode off |
| offset ΔV | — add ΔV Volts to the signal (default is 0 V) |
| gain G | — multiply the quantity (signal + ΔV) by G (default is 1) |
| att [n] | — set the attenuation in the IF path to 0 dB [n dB] |
| getatt | — display the attenuation in the IF path |
| trigger 0 | — set the signal sampling to the internal VXI clock |
| trigger 1 | — sample the signal synchronously with the power supply (230 V) |
| spectr 0 | — abandon the spectrum analyser |
| spectr 1 | — run the spectrum analyser |
| fa f | — set the starting frequency f [in MHz] for the spectrum analyser |
| fb f | — set the end frequency f [in MHz] for the spectrum analyser |
| vb Δf | — set the video bandwidth Δf [in MHz] for the spectrum analyser |
| rl p | — set the reference level p [in dBm] for the spectrum analyser |
The program that displays graphically the spectrum, spectr, resides in the directory /home/rt4/vxi/analyser/.
III.4 The sigmon Program — R. Feiler
 |
To display a signal (voltage) coming from the antenna and AD converted call:
| sigmon |
| • Y– | — move the diagram down |
| • Y+ | — move the diagram up |
| • Y*2 | — double the voltage range |
| • Y/2 | — half the voltage range |
| • Auto: OFF/ON | — auto (ON) or manual (OFF) scaling of the diagram |
| • Chan. n | — use channel No n, 0 ≤ n ≤ 7 |
| • Clean spikes: YES/NO | — remove (YES) or do not remove (NO) interference (spikes) from the diagram |
| • last Δt min./hr | — set the time span for the display (for horizontal axis), where Δt = 1, 2, 5, 15, 30 min. or 1 hr |
| • Max. v V | — set the voltage range (vertical axis), where v = 4, 8, 16, 32 or 64 |
| • Sample: Δt s | — set the sampling interval to Δt seconds |
| • Open/Close file | — open or close a file where signal data will be or were written |
| • Freeze/Unfreeze | — freeze or release the displayed diagram |
| • Time offset: Δt min. | — show the data displayed Δt minutes previously; 0 ≤ Δt ≤ 60 |
| • No avg. value xxxx Avg.last n sec/min. | — no averaging average over n = 5, 10, 15, 30 s, 1, 3 or 5 min. |
ftp trao2 login: oper password: *********** cd /temp/dat get filename.dat |
Remark: If there are problems during initialization of the sigmon, check the active processes in the hpterm system window. To this end use the Unix command ps -d. Now if more than one VXI process is being run, stop them one by one (beginning with the VXI program, if it is active) using the kill process_No command.
III.5 The track Program — G. Hrynek
The track program serves the purpose of graphical presentation of the telescope movements and current positions of celestial objects above the horizon. It can be run by issuing the following command from any place in the trao2 computer.| track |
Mouse usage
Placing the mouse cursor on an object and clicking the left button causes
the name of the object to be displayed. Press the right mouse button to
obtain detailed data of the object shown in a separate window.
Steering of the antenna
This program also makes it possible to control the telescope movements.
To this end one must mark (enable by clicking) two options (described below)
with the same name. A button of
one of them can be seen on the right side of the top menu bar and the other is
inside the 'Options' menu (on the left of top margin). When both the options are
enabled, a blinking 'WARNING' will appear in the center of the window. After
the program has issued commands for the telescope to move to a desired source,
the options are automatically disabled. This scheme would not work if a user
tried to point the antenna any place off source.
| Button commands (a button pressed gets enabled) | |
| • Show | — display current antenna state (without sources) |
| • Calibration Source | — display visible calibration sources |
| • Blazars | — display visible blasars of the 9 used in an RT4 project |
| • Pulsars | — display visible pulsars (data base includes all the 88 pulsars observed with the RT4) |
| • Masers | — display visible masers (selected of about 1300) |
| • Other | — display visible sources from user's data base (see comments below) |
| • Move telescope | — point the antenna to the chosen source (one of two options required) |
Options (enabled option gets a small square to its left) | |
| • Source name | — add names to the displayed sources |
| • Move telescope | — the second option (besides the button described above) that enable pointing of the antenna to another source |
| • Tracking line | — display source positions from its rise to set |
| • Symulation | — allows for displaying of selected sources for any given date and time |
| • Show source position | — display the position of a source (defined in a separate window) |
| • Search source | — find an object among currently displayed |
| • Make calibration | — allows for carrying out of calibration measurements |
| • System cooled/not cooled | — allows to select one of two pulsar lists corresponding to cooled (option enabled) and uncooled current receiving system |
It is possible to use one's own source data base for displaying
on the map. The file name of such data base must not exceed 10 characters
and there may be no more than 1500 sources in it. Each source in the data
base must consist of the following fields: name RAh
RAm RAs Dec° Dec' Dec" epoch,
where RA is the right ascension, Dec is the declination
and epoch is the epoch of these coordinates. Here is an example:
w3oh 2 23 17 61 38 58 1950
III.6 Dealing with Problems — M. Gleba
In case of improper behaviour or complete halt of the RT32 one must proceed according to the symptoms.• Commands are still being accepted by the steering program
If however the system does not accept commands issued in the Receivers Command Module window, one should key in these two commands into the RT4 Command Module window: festo mr0.100=$76 festo mr0.100=$77which reset the computer in the secondary focus cabin. The above commands mast be typed very carefully, because a small misprint may affect other devices.
It may happen so that the system behaves as if the telescope stood still despite commanding it to a source with the ps command. One can find whether it moves or not by checking the RT4 window and paying attention to the time displayed therein. If the reading of time does not change (with about every second) then there is a real problem with the telescope control. Otherwise the system only 'cheats' and the operator should stop the telescope (with the pd command), then move it using the pp A z command and finally repeat the ps α δ command. Similar 'cheating' may happen when a source to be observed lies below the telescope horizon, i.e. when the source altitude is smaller than 3°.
If the described method does not suffice, one may reset the system with the qu command.
• Commands are not accepted
This case requires the operator to go to the electric cabin (No 163) under the telescope to reset the computer there.|
Remark: The instructions that follow are temporary and
the suggested actions may be done only by entitled persons. |
Further actions:
- 1. Check the state of the elevation and azimuth drives — green control lights on (ready)
- 2. Check readings from the Lenze drives:
- — the Slave type drives normally provide the C56 code — the Master type drives normally communicate the C51 state
cabinet No 4 — the fuses FT11-2 through FT14-2,
cabinet No 6 and 7 — the fuses FT21-2 through FT28-2.
In case an overload has occurred, automatic and other fuses (e.g. FT11 to FT14) may have switched off the power supply.
- 3. An ill behaviour of the system may also be caused by an improper communication between the Master and Slave drives (thus check the corresponding cables).
- 4. Check also the state of fuses of brakes (cabinet No 8); the green control lights on the door of the cabinet should be on.
- 5. In the cabinet No 10 the fuses FF33 are permanently switched off.
- 6. Check fuses in the cabinet No 6 and 7.
| How to read error codes of FESTO: Under DOS operating system issue the command festo, then type md=h so that what obtains will be hexadecimally coded; now use dr 1.1 to get an error number itself. Such error numbers are to be checked against the tabular listing, that can be found in the electric cabin (next to the computer). Hexadecimal numbers of further possible errors that might have occurred during the start of the system can be displayed by repeted use of the same command, i.e. dr 1.1. |
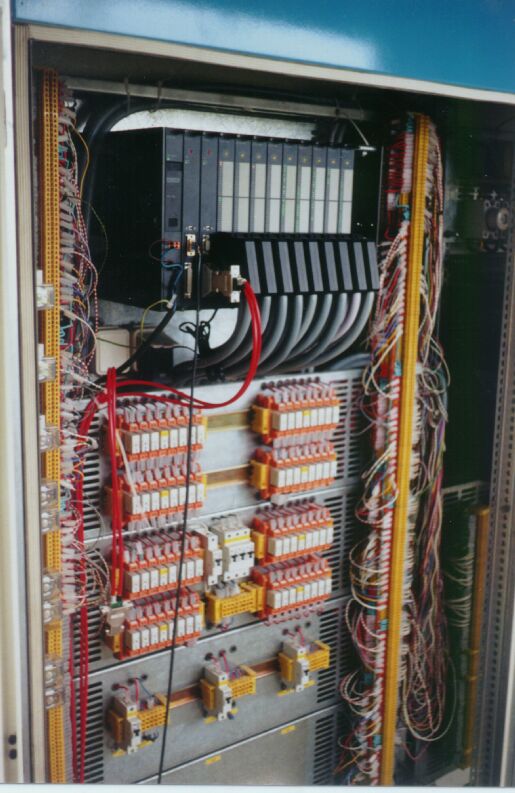 |
| Fig. III.4: FESTO controller |
File first posted on 23 Feb 2004.