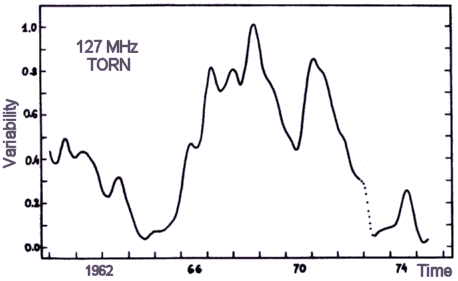
Fig. 1. Smoothed monthly mean variations of the variability index as evaluated at Toruń Observatory on 127 MHz during the 20th solar cycle (after Borkowski, 1975b).
Institute of Astronomy, N. Copernicus University, Toruń, Poland
Almost all the observatories reporting the single-frequency observations
on meter wavelengths always do report 3-hourly and daily means of variability
index in the table of Daily Data.
The variability index is a measure of the peakiness or "burstiness" of the noise storms (mainly type I bursts). The variability scale has four indices, 0 to 3, where 0 stands for quiet and 3 — violent sun. It is emphasized that the variability measures the degree of fluctuations on a relative scale (i.e. relative to the enhancement of the background radiation or to the median level).
Up to 1974 there existed many substantially different criteria of variability evaluations at various stations. However in the same observatory using its own unchanged criteria the analysis depends still upon the observers individuality and interest in his work (Elgaröy, 1965, Podstrigach et al., 1974, Markeev, 1974, Yamashita, 1974, Castelli, 1974, Borkowski, 1975a, Böhme, 1975). Where does such great variety of criteria come from?
In 1957 Smerd has proposed the variability measure that may be expressed by the formula
| (1) |
where S is the median flux over the period T, during which n peaks each of intensity Si occur. In the second instruction manual by Fokker (1963) there is suggestion to the observers to use the estimated enhancement of the background flux density above the quiet sun flux level as the relative unit instead of the median level S as in formula (1).
Later on, some observers have followed the Smerd's measure, some of them the Fokker's and others, more independent ones, used their own criteria. Beginning from January 1975 observers were asked to follow the last instruction (Tanaka, 1974) and the formula (1) is recommended there. However even now the observer faces old difficulties since basing on this very measure it is impossible to find out adequate criteria of estimation in the case of the small intensity noise storms (the most frequent ones), i.e. when a mean relative amplitude of peaks varies around unity. Such storms, if well peaked, should be given at least the index 1 whlie from formula (1) it is clear that it would be 0 regardless of the peaks count and chosen scale.
It should be remembered that the aim of the variability along with the mean flux classification is to reflect the true activity of the Sun during the noise storm. To make the description of the activity more objective the observer has to be given some clear criteria of measuring or estimations. Besides, the existing ones are far from consistence and that in turn leads to the nonuniformity of reported results.
These circumstances induced the author to work out a new expression of the variability that leaves unchanged the main rules commonly used up to now. Additionally, some new aspects were taken into consideration.
It is rather easy to see that a variability index measure should weigh equally well the amplitude and the number of the peaks belonging to the noise storm since the total flux of the storm peaks reflects the degree of the solar activity which is due to what is called "variability".
The integrating time constant of the low frequency section of the receiving system strongly influences the recorded burst amplitude, and its shape as well. Basing on the widely known dependence of the standard deviation of the Gaussian noise amplitude upon the time constant and taking into account very limited observational materials at 127 MHz it was assumed that the mean amplitude of the storm peaks can be roughly approximated by inverse proportionality to the square root of the time constant.
Since the dynamics of the noise storms is not uniform over the whole metric wave range, in order to make the variability scale equally effective on different frequencies one has to use a normalizing factor. This factor should be inversely proportional to the mean storm dynamics at a given frequency.
It is known that for technical reasons estimations of the variability index have always been done by eye, i.e. inspecting an analogue record. The logarithmic scale for variability measure seems to be the most proper, because biological laws (namely the Weber-Fechner law) also relate to the logarithmic dependence of an impression on an incitement. The common logarithm was found convenient to fit the previous results of variability estimations of 127 MHz observations made in Toruń over the last few years to the new scale.
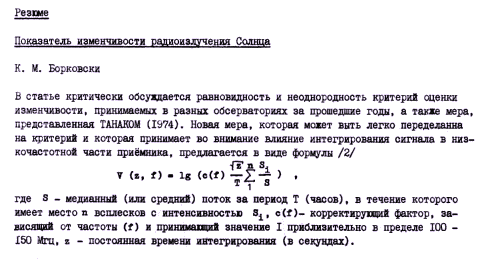
The proposed variability index measure in its general form can be finally expressed by
| (2) |
where S is the median (or mean) flux over the period T (hours) during which n peaks each of intensity Si occur, C(f) is a correction factor depending on the frequency which takes value 1 in the range of about 100 – 150 MHz, and t is the LF (output) time constant (in seconds).
The last formula may be rewritten in a more convenient presentation directly useful in practice. For exemple, taking for C(f) value 1, for t 1 s and putting for V(t,f) in the sequence the values of 0.5, 1.5 and 2.5 one obtains the following criteria of estimation:
Peaks count per hour 0 to 3 4 to 31 32 to 320 >320 Variability index 0 1 2 3 |
In order to avoid attaching too much weight to very high peaks while evaluating the indices it is suggested to skip all the bursts that are to be listed separately in the Outstanding Occurrences table.
For the purpose of adopting the measure (2) to the observations at a given frequency f it is necessary to review previously evaluated results to find out the value of C(f) that best fits to this formula. But to have it normalized to overall metric band results one has to compare ones own measure with an other at the frequency fo believed to have a well determined factor C(fo). The correct value of C(f) may be derived from (Borkowski, 1975b):
|
(3) |
where ΔV is the mean difference of the monthly means of the results found at the frequencies fo and f over long enough period (of order of a few years). Figure 1. shows an example of the smoothed monthly means variations of the variability index at 127 MHz as evaluated during 20th solar cycle at Toruń Observatory.
 |
|
Fig. 1. Smoothed monthly mean variations of the variability index as evaluated at Toruń Observatory on 127 MHz during the 20th solar cycle (after Borkowski, 1975b). |
The author wishes to express his thanks to dr A. Böhme, prof. J.P. Castelli, dr Ö. Elgaröy, prof. S. Gorgolewski, dr J. Hanasz, dr A.K. Markeev, dr J. Usowicz and dr F. Yamashita tor their kind and helpful contributions.
REFERENCES
Böhme, A. , 1975, private communication.
Borkowski, K.M. , 1975a, Służba Słońca na częstości 127 MHz w Obserwatorium Toruńskim, Postępy Astronomii, in press [XXIV, Zeszyt 1, 15–31].
Borkowski, K.M., 1975b, Wskaźnik zmienności radiowego promieniowania Słońca, Postępy Astronomii, in press [XXIV, Zeszyt 2, 115–123].
Castelli, J.P., 1974, private communication.
Elgaröy, Ö.,1965, Inst. theor. Astrophys. Rep. 16.
Fokker, A.D., 1963, IQSY Instruction Manual, Solar Activity, Part II, London.
Markeev, A.K., 1974, private communication.
Smerd, S.F., 1957, Supplement to the IGY Instruction Manual, Solar Activity, Sydney.
Tanaka, H., 1974, Instruction Manual for Monthly Report, ICSU-IAU WDC-C2, Toyokawa.
Yamashita, F., 1974, private communication.
Yudin, O.I., Podstrigach, T.S., Vedeneev, Y.B., Durasova, M.S., 1974, Solar Radio Emission, Zimenky Station, 83, 13.
 |