EVN Calibration Issues
— Summary of to-dos
Kaz Borkowski
Torun Centre for Astronomy,
NCU, Torun, Poland
This document is heavily based on earlier reports of studies carried out
in 2007. Discussions over the internet and during the TOG Meeting at Yebes
rectified and enriched my understanding of certain aspects, therefore I felt
it necessary to collect ideas that are worth implementation in a new document.
I intend to maintain this page by adding information on possible reactions
from VLBI community and on new ideas if and when they are put forward.
The mentioned reports are as follows:
EVN Calibration scheme

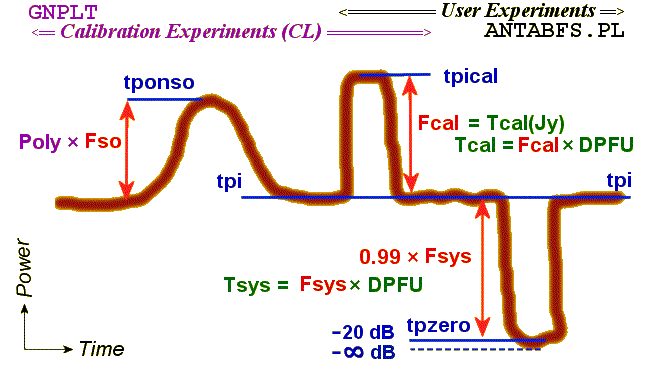
| Fig. 1: The idea and practice of EVN calibration. In this diagram, the thick curve represents the power of signal at BBC or VC outputs as a function of time. The three prominent features correspond to a source of known flux density Fso (left), calibration signal from noise diode Fcal (middle), and a depression due to 20 dB (factor of 100) attenuated background 0.99 Fsys (right). The original Field System readings tp... as recorded in the experiment logs, i.e. counts as read from total power integrators, are marked in blue. The broken line just below tpzero shows the level expected of an infinite attenuation, the small difference being equal to Fsys / 100. Calibration experiments serve to determine the gain curve Poly as a function of the elevation and the equivalent flux density of diode signal Fcal, or its temperature equivalent Tcal, at number of frequencies, using the GNPLT application. The results are kept in special rxg files. Continuous monitoring during user experiments relies on so obtained Fcal to determine SEFD = Fsys / Poly, required by the final user to scale his maps. In practice, this is accomplished with the ANTABFS.PL script which uses tp... measurements (performed while observing target sources and collected in the log files) along with Tcal and Poly (taken from the rxg files) to produce tables of Tsys, accompanied by DPFU and Poly data. |
Methodological issues
(A) make data acquisition of more important quantities,
these that are to be later differenced (tponso, tpi and tpical), to take place
immediately one after the other. This would minimize the effect of slow
variations in receiver gains. While doing this we might
(B) assign the lowest priority to the gain compression
(onsource tpical) and Tsys measurements (tpzero),
which do not directly contribute to accuracy of the final results
(Tcal and Poly determinations). A minimal version of basic sequence could
be e.g.
Let the i-th of N sections of averaged data have the mean value xi and
the variance vi (in practice to be calculated as the RMS squared),
then weighted means x stored in logs could be calculated as
where the summations are carried over all the N sections.
The x quantity represents an unbiased estimate of the mean value in the entire
integration period. So obtained value has in general an expected error (standard
deviation or RMS value) different than the one for the normal (arithmetic)
full period averaging, which would be just
σ
= (Σ vi)1/2/N.
It is proposed that for the suggested
kind of weighting the error of x be estimated from
x = (Σ xi/vi) /
Σ 1/vi, (1)
Note, however, that when all vi happen to assume the same value,
vi = N σ2, these
formulae get equivalent
to the case of arithmetic averaging. Setting N = 1 reduces them similarly.
σ'
= 1 / (Σ 1/vi)1/2.
(2)
Being relatively simple, the extra computations according to Eqs. (1) and (2)
above could possibly be implemented without excessive FS changes. They,
of course, would not require any other procedure to be modified. However,
such tools as GNPLT and ANTABFS should independently implement, wherever
possible, a weighting of processed data using the errors (or standard
deviations) stored in logs by the FS. In this case, combating of interference
on a longer time-scale would be aimed at.
GNPLT wishlist
- Names of currently used rxg file and analysed log file could
be displayed somewhere within the GUI.
- Such plots like Plotting TCal(K) vs. Frequency have only three widely separated ticks with labels on their
scales. More ticks (with or without labels) would be welcome.
- A new option to display error bars would also be useful in discerning
bad points.
- A new option to toggle inclusion/removal of IFa and
IFb (wide bandwith) points. Presently they are included automatically,
if present in the log file, which may lead to false Tcal if the user does
not explicitely delete them. A CL experiment may be scheduled not to record
these data, but they are in fact useful in case of problems.
ANTABFS wishlist
- When the final plot with all channels is displayed
(as in this example) it is
difficult to identify in it a particular BBC/channel. Therefore,
it would be helpful to have displayed also a color-channel legend.
- For each frequency channel the ANTABFS lets the user to choose from keyboard an option to edit or go ahead to the next channel. When upon inspection of the displayed measurements he decides to edit, the display is replotted and only then the editing is enabled. If observations are made in the presence of RFI (which happens almost always at L-band), virtually every channel (BBC and sideband) data have to be edited during the ANTABFS session. Life of the user would thus be more pleasant if he got the editing enabled already in the first popup of displayed data and had there one or two more options (something like 'proceed to the next channel' in addition to 'end editing and replot') for picking with the mouse, besides these keyboard options. The idea is to free the user of excessive switching between windows (the x-window where ANTABFS runs, and the graphical display of output data).
| Posted on Dec 3rd, 2007 | Last updated: Dec 6th, 2007 |